Both approaches balance two competing truths: teams should pay for capacity they reserve, but they shouldn’t be shielded from the cost of capacity they actually burn. The FinOps Foundation recommends exactly this kind of weighted formula because it discourages both over-requesting and silent overuse.
You need three data inputs before you calculate anything: an AWS Cost and Usage Report (CUR) or equivalent billing export, pod and node metrics from Prometheus, and a reliable pod-to-node mapping snapshot taken at regular intervals.
Three moves get you from zero to a working pilot in one sprint:
- Turn on per-namespace visibility using existing metrics, even before billing data is wired in.
- Enforce a required label set (team, environment, cost-center) at the admission layer, not by convention.
- Run the Vertical Pod Autoscaler (VPA) in recommendation-only mode to start collecting rightsizing data without touching production.
Key takeaways
The most durable Kubernetes cost allocation programs pair a hybrid or Max(request, usage) formula with strict label enforcement and a 90-day showback period before chargeback.
| Choose a defensible formula | Start with a hybrid weighting favoring request-based allocation and validate over a period of time. | Fix the pipeline inputs first | AWS CUR, Prometheus metrics, and pod-to-node mapping snapshots are non-negotiable prerequisites. | | Sequence your savings work | Rightsize with VPA, then improve node efficiency, then tune autoscalers, then build chargeback. | | Keep unallocated cost under 5% | Enforce labels at the admission layer and reconcile weekly before presenting numbers to finance. | | Get expert help operationalizing it | Cost Beacon builds the audit, rate card, and allocation pipeline, and clients average a significant bill reduction on a pay-on-savings basis. |
Table of Contents
- Why Kubernetes cost allocation is hard and what it has to solve
- Which allocation model should you use: request, usage, or hybrid?
- How should shared costs and idle capacity be handled?
- What tools and pipelines actually implement this?
- How do you turn allocation data into real savings?
- How do you govern labels and enforce allocation accuracy?
- Showback, chargeback, and reconciling against the actual bill
- What causes allocation discrepancies, and how do you debug them?
- How Cost Beacon operationalizes Kubernetes cost allocation
- A practical priority list for cloud engineers and FinOps teams
- Essential docs and next-step links
- Get your Kubernetes cost allocation built by engineers, not guesswork
- Sources
Why Kubernetes cost allocation is hard and what it has to solve
A single EC2 invoice line doesn’t map to a single team, and that’s the root problem. Kubernetes bin-packs dozens of pods from different owners onto the same node, so the moment you try to split that node’s bill, you’re allocating a shared resource, not billing a dedicated one.
Three technical realities make this harder than splitting a cloud bill by tag:
- Shared node billing breaks 1:1 mapping. One EC2 instance runs workloads from multiple teams simultaneously, so cost has to be apportioned by consumption, not assigned wholesale.
- Observability itself costs money. Prometheus storage, high-cardinality metrics, and log ingestion can become a meaningful line item on their own, and the Splunk research on Kubernetes cost management flags this as a discipline teams routinely underestimate.
- Control-plane costs need explicit treatment. Managed Kubernetes fees, load balancers, and cluster add-ons don’t belong to any one namespace, yet they show up on the bill every month.
Get allocation right and you unlock two outcomes finance actually cares about: showback (visibility without billing) as a trust-building first step, and chargeback (real internal billing) once the numbers hold up under scrutiny. Both depend on rightsizing data that’s accurate enough to prioritize engineering time against real dollar impact, not guesswork.
Which allocation model should you use: request, usage, or hybrid?
Three formulas cover almost every real-world case, and each creates a different behavioral incentive for engineering teams.
Request-based allocation charges a namespace for the CPU and memory it requests, regardless of what it actually consumes. Formula: cost = (namespace requested vCPU-hours / cluster total requested vCPU-hours) × cluster cost. This is simple to calculate and hard to argue with, but it rewards teams that under-request and penalizes teams that request generously as a safety margin, even if they never touch that headroom.
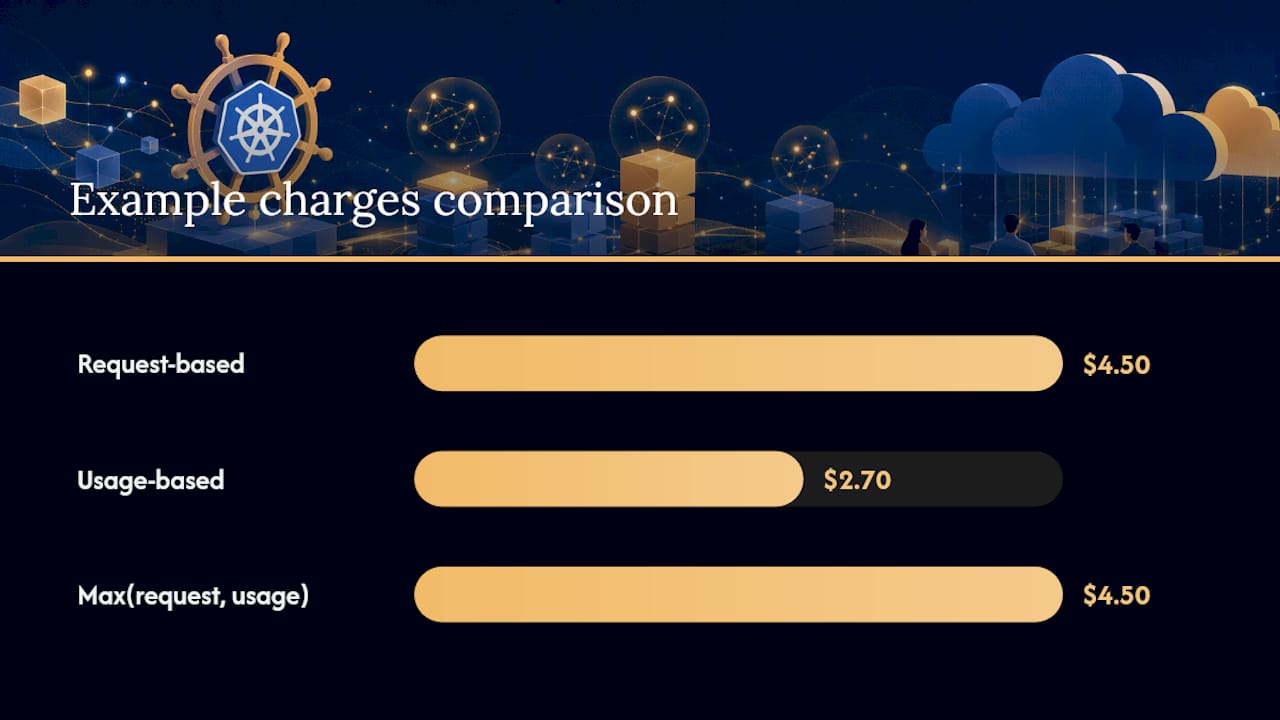
Usage-based allocation charges for actual consumption: cost = (namespace actual vCPU-hours consumed / cluster total actual vCPU-hours) × cluster cost. This is fairer in principle but creates a perverse incentive: teams learn that under-provisioning requests (and risking throttling or OOM kills) lowers their bill.
Max(request, usage) takes whichever number is higher per pod, per interval. It’s the most defensible model in front of finance because no team can game it in either direction.
Consider a worked example: a cluster with an effective rate of $0.045 per vCPU-hour (blended across Spot and Savings Plans capacity). A namespace requesting 100 vCPU-hours but actually using only 60 gets charged under request-based ($4.50), under usage-based ($2.70), and under Max ($4.50, the higher figure). Flip the numbers, requesting 60 but bursting to 100, and Max still charges the higher, more honest $4.50.
- Start with hybrid 70/30 (request/usage) or Max(request, usage) for the first 90 days.
- Reconcile allocated totals against the actual AWS invoice weekly during that window.
- Adjust the weighting only after you’ve seen at least one full billing cycle of drift.
The FinOps Foundation’s guidance on calculating container costs backs this iterative approach: pick a defensible starting formula, then validate and adjust weights over a 30 to 90 day window rather than trying to perfect the math up front.
How should shared costs and idle capacity be handled?
Every cluster carries overhead that no single namespace owns, and pretending otherwise is how allocation projects lose credibility with engineering teams.

Four buckets typically need a home: the Kubernetes control plane fee, monitoring and observability infrastructure, cross-cluster networking (NAT gateways, load balancers), and idle capacity, meaning provisioned nodes running below full utilization.
You have three realistic policies for distributing these:
- Platform absorbs idle capacity. The infrastructure team eats unallocated headroom as a cost of doing business, keeping team-level bills clean and predictable.
- Proportional split. Shared costs get divided across namespaces by their share of total allocated spend, so every team carries a small piece of overhead.
- Hybrid disclosure. Direct workload costs get charged normally, while shared costs are shown separately on every report, visible but not billed. This tends to be the easiest sell to engineering leadership because nobody feels blindsided by a mystery line item.
Above that threshold, the numbers won’t survive a finance review, and you’ll spend more time defending the model than improving it.
What tools and pipelines actually implement this?
A working AWS-based pipeline generally looks like this: CUR export → S3 → Glue or Lambda transformation → Athena queries → allocation engine → dashboard. Each stage has a specific job, and skipping one usually shows up as a reconciliation gap two months later.
- CUR lands in S3 on whatever schedule AWS delivers it (daily or hourly, depending on your configuration).
- Glue jobs or Lambda functions normalize the raw CUR data and join it against your pod-to-node mapping snapshots.
- Athena queries aggregate cost by namespace, label, and workload, applying your chosen allocation formula.
- An allocation engine, whether custom-built or an open-source tool, applies the Max(request, usage) or hybrid weighting and produces per-team totals.
- A dashboard surfaces the results to engineering and finance on a recurring cadence.
For the allocation engine itself, OpenCost is the leading open-source option for real-time Kubernetes cost measurement and is a practical starting point before evaluating paid platforms. Kubecost builds on similar underlying logic with a more polished UI and enterprise features like multi-cluster rollups. Both tools require Prometheus metrics as input and both need node price normalization configured correctly, meaning the tool has to know your actual blended rate, not AWS list price, or every number downstream will be wrong.
If you’re running on Google Kubernetes Engine instead of, or alongside, EKS, GKE’s native cost allocation feature injects Kubernetes labels directly into the Cloud Billing export. Google’s own documentation on GKE cost allocation is worth reading closely: the feature is request-based rather than usage-based, has a cap on the number of labels it tracks, doesn’t cover every SKU, and can meaningfully increase your BigQuery storage and query costs once enabled at scale.
| Pipeline stage | AWS-specific consideration |
|---|---|
| Billing export | CUR delivered to S3, includes EC2, EBS, ELB line items |
| Rate normalization | Blend Spot, on-demand, and Savings Plans into daily effective $/vCPU-hour |
| Metrics collection | Prometheus scrapes container_cpu_usage_seconds_total, container_memory_working_set_bytes |
| Allocation engine | OpenCost or Kubecost, both require normalized node pricing |
How do you turn allocation data into real savings?
Allocation tells you where money goes. Turning that into savings requires a specific execution order, and skipping steps is the single most common reason optimization projects stall.
- Rightsize first. Run VPA in recommendation mode against P95 or P99 usage data before touching anything else. This step alone typically recovers a substantial share of wasted compute, since most teams over-request CPU and memory by a wide margin out of caution.
- Improve node efficiency next. Once requests are accurate, bring in Karpenter or Cluster Autoscaler to consolidate workloads onto fewer, better-matched nodes, and shift eligible workloads to Spot capacity.
- Tune workload autoscaling. With rightsized requests and efficient nodes in place, configure HPA or KEDA to scale replica counts based on real demand instead of static counts.
- Only then build visibility and chargeback. Allocation numbers calculated against a wasteful baseline just enshrine the waste in a report. Fix the underlying spend first.
This sequence isn’t arbitrary. The K8s lays out this same rightsizing-then-autoscaling-then-visibility order as the pattern that produces durable savings rather than a one-time dip that creeps back up.
Pro Tip: Roll out VPA changes to one namespace at a time and watch for 7 to 14 days before expanding. A recommendation that looks safe in aggregate can still cause throttling on a bursty workload if you apply it cluster-wide on day one.
To measure impact, capture node count and total cluster cost before you start, then compare against the same metrics 30 and 60 days after each phase. A clean before-and-after comparison, tied to the specific step that caused it, is what makes this defensible in a budget review.
How do you govern labels and enforce allocation accuracy?
Allocation accuracy dies quietly when labels drift, so governance isn’t optional overhead, it’s the thing that keeps your numbers trustworthy six months from now.
Define a minimal label taxonomy and enforce it, don’t just document it:
teamorcost-center: identifies who owns the workload for billing purposes.environment: separates production from staging and development spend.apporservice: enables workload-level drill-down beyond the namespace.
Enforce these labels at the admission-controller layer using Gatekeeper or Kyverno, rejecting any pod spec that’s missing a required field rather than relying on team discipline. Pair this with ResourceQuota and LimitRange objects at the namespace level to prevent a single misconfigured deployment from claiming far more capacity than it needs and skewing your allocation numbers for the whole cluster.
Add a CI check to your pipeline that fails any pull request applying manifest changes without required labels present, and consider a second check that flags resource requests changed without a corresponding VPA recommendation on file. Both checks are cheap to build and prevent the slow label decay that makes six-month-old allocation data unreliable.
Showback, chargeback, and reconciling against the actual bill
Showback should run for roughly 90 days before you attempt chargeback, giving finance and engineering time to trust the numbers before real money moves between budgets. That guidance from practical field experience with Kubernetes cost optimization matches what most FinOps teams find in practice: rushing to chargeback before the model is validated erodes trust fast.
Set a reporting cadence and stick to it:
- Weekly dashboards for engineering teams, showing namespace-level cost trends and anomalies.
- Monthly reviews with finance, covering total spend, unallocated percentage, and any policy exceptions.
Track three KPIs consistently: cost per namespace, unallocated cost as a percentage of total spend, and an efficiency ratio (allocated cost divided by total cluster spend) that tells you how much of the bill your model actually explains.
Before you present any number to finance, run this reconciliation checklist:
- Validate the effective $/core-hour used in the current period against actual Savings Plans and Spot pricing.
- Reconcile EBS and load balancer line items separately, since these often get missed in pod-level allocation.
- Document every exception (a namespace deliberately excluded, a shared cost bucket handled manually) so the model’s assumptions are auditable later.
What causes allocation discrepancies, and how do you debug them?
When your allocated total doesn’t match the AWS invoice, the gap almost always traces to one of a small number of causes.
- Labeling gaps. Pods without required labels get dumped into an “unallocated” bucket, and if that bucket exceeds 5%, something upstream in your CI enforcement is failing.
- Short-lived pods. Batch jobs and CronJobs that spin up and terminate between metric scrapes never get captured, undercounting their real cost.
- Unsupported SKUs. Some AWS line items, particularly newer service types, don’t map cleanly into standard CUR categories, so check for orphaned charges each month.
- Node startup and shutdown windows. Autoscaling events create brief windows where nodes are billed but not yet running scheduled pods, inflating idle capacity if not accounted for.
To backfill pod-to-node mapping gaps, pull a full sample week of Prometheus data and cross-check it manually against CUR line items before trusting the pipeline for a full month.
How Cost Beacon operationalizes Kubernetes cost allocation
Building this pipeline internally takes real engineering time, time most teams would rather spend shipping product. Cost Beacon runs the audit and build-out for you: a full review of your cluster’s billing data, a dynamic rate card reflecting your actual Spot, on-demand, and Savings Plans mix, and a working allocation pipeline tied to VPA and autoscaler tuning recommendations.
The engagement covers:
- A cost and security audit across your Kubernetes, AWS, GCP, or Azure footprint.
- A dynamic rate-card build reflecting your real node purchase mix, not list prices.
- Allocation pipeline implementation, from CUR ingestion through namespace-level reporting.
- VPA, HPA, and Karpenter tuning recommendations with a prioritized action plan.
- Label taxonomy and admission-policy governance setup.
Clients see a significant average bill reduction across industries including fintech and telecom. You only pay based on savings actually realized, a no-win, no-fee structure that keeps the incentive aligned with your outcome not ours.
A practical priority list for cloud engineers and FinOps teams
Pilot one cluster or namespace before you touch anything company-wide. Every allocation model looks clean on paper until it meets a real cluster’s messy label history and legacy workloads, and you want to find those edge cases on a small, low-stakes slice first.
Prefer showback over chargeback for at least a full quarter. Teams that get billed based on a model they don’t trust will spend more energy disputing the numbers than fixing the underlying waste, which defeats the entire point of the exercise.
Let the platform team absorb idle capacity where possible. Pushing every unused CPU-hour onto workload teams creates resentment toward a metric they don’t control, and it makes the whole system feel punitive rather than useful.
Revisit your allocation weights quarterly, not annually. Node pricing mixes shift, workloads change shape, and a formula that was accurate in January can drift by summer if nobody checks it.
— Aaditya Parashar
Essential docs and next-step links
- Calculating Container Costs — FinOps Foundation
- FinOps framework phases — FinOps Foundation
- Kubernetes cost management — Splunk blog
- GKE cost allocation documentation — Google Cloud
- OpenCost project documentation
- K8s
- Kubernetes cost allocation — CloudBolt
Get your Kubernetes cost allocation built by engineers, not guesswork
Everything in this guide, the CUR pipelines, the rate-card math, the VPA rollout sequencing, takes real engineering hours to build correctly the first time. Cost Beacon does that work for you: a full audit of your Kubernetes, AWS, GCP, or Azure environment that pairs AI-driven analysis with hands-on engineers who’ve built these allocation pipelines before.
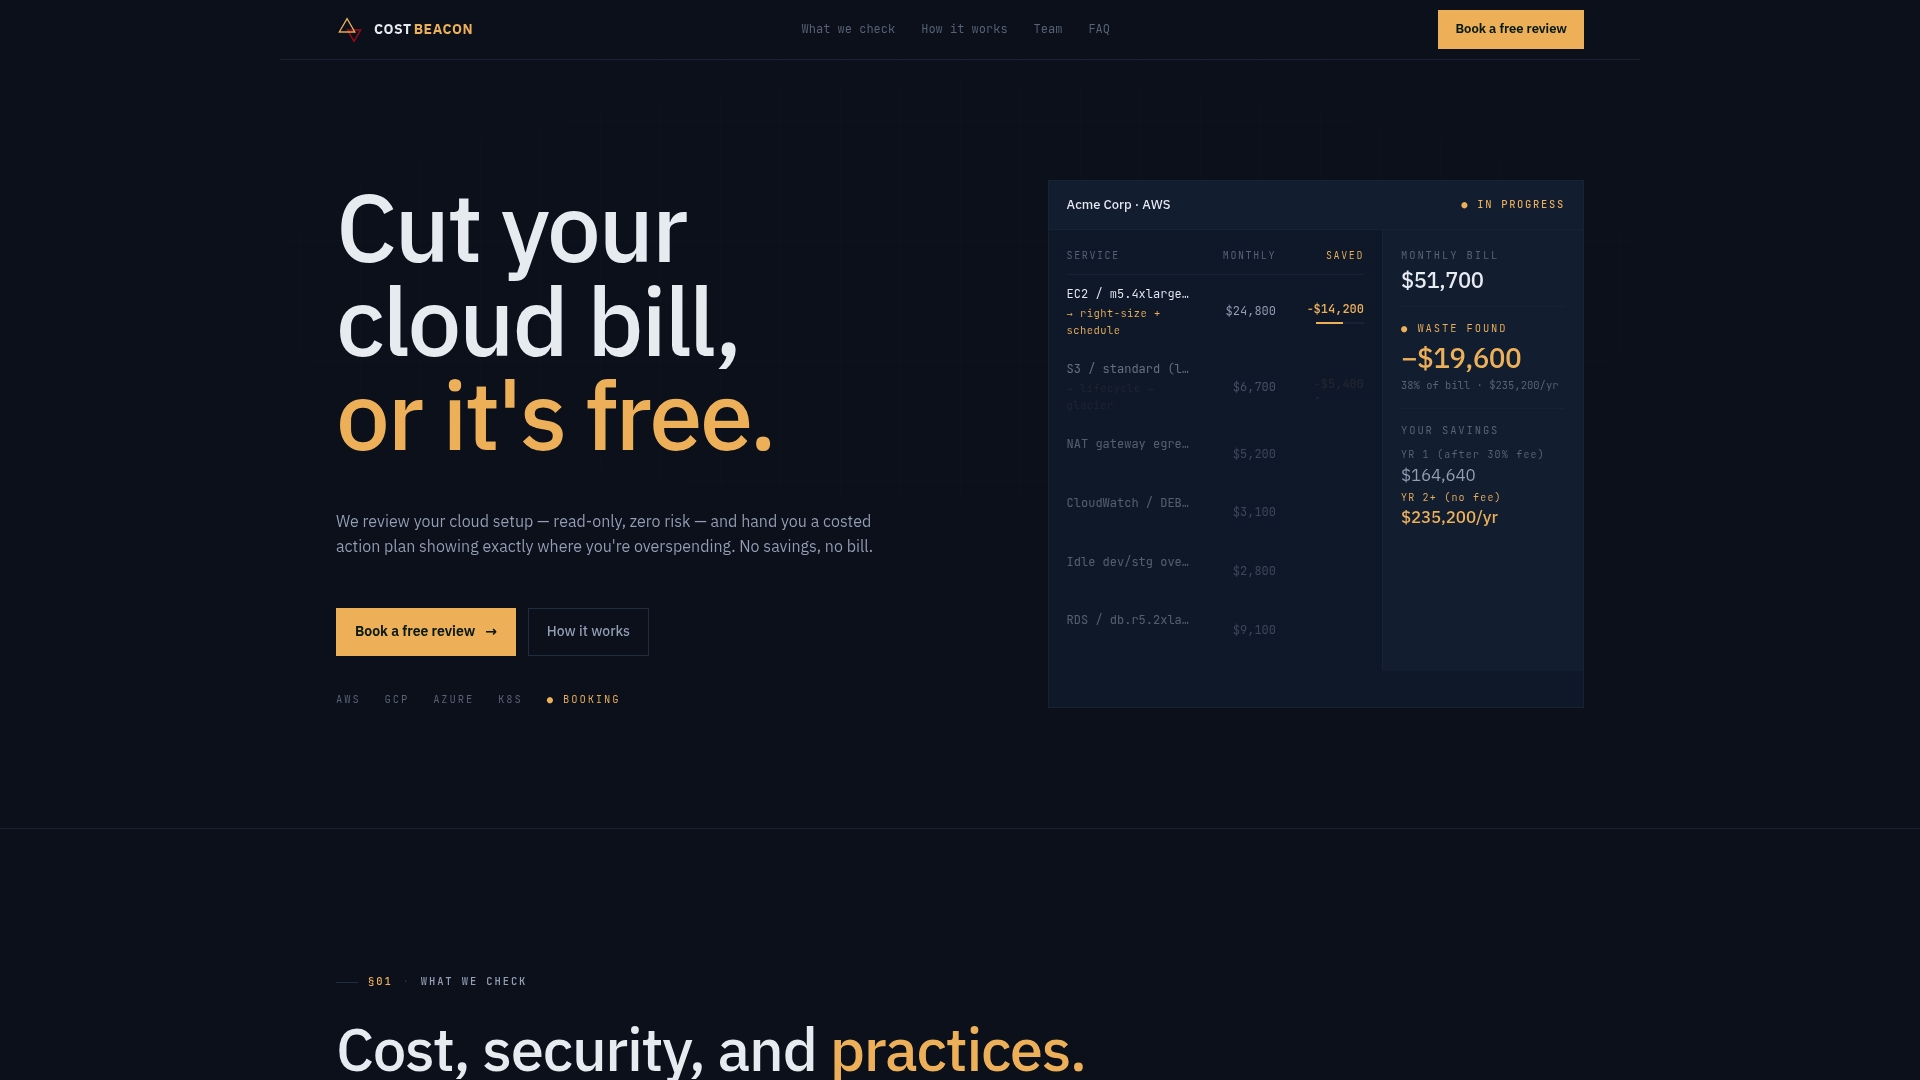
You get a prioritized action plan with expected savings per item, covering rightsizing, node efficiency, and allocation governance, not a generic report. The engagement is risk-free: Cost Beacon only invoices a percentage of savings you actually realize, so there’s no upfront cost and no retainer sitting on your books either way. If your cluster’s cost data feels more like a mystery than a management tool, start a cloud cost and security review with Cost Beacon and get a concrete plan for what your Kubernetes spend should actually look like.
Sources
Everything downstream depends on getting three raw inputs clean before you write a single allocation formula.
Pro Tip: Sample pod-to-node mapping every 5 minutes rather than continuously. Continuous capture inflates your metrics storage bill fast, and 5-minute granularity is usually tight enough to reconcile against hourly billing data without drowning your Prometheus instance.
A few operational notes worth planning around before you build the pipeline:
Retention policy matters more than most teams expect. Keeping raw high-cardinality pod metrics for 90 days can quietly become one of your largest observability costs, so downsample after 7 to 14 days and keep only aggregates beyond that window.
Query cost adds up too. If you’re pushing this data into BigQuery or Athena for reporting, partition by date and cluster to keep scan costs down. An unpartitioned table that gets queried daily by five different dashboards will generate a surprising query bill of its own, which somewhat defeats the purpose of a cost allocation project.
Recommended
Aaditya works on cloud cost and platform engineering at Cost Beacon, mostly on AWS and Kubernetes estates that grew faster than anyone planned for.
 Cost Beacon