The fastest way to cut Databricks spend is to move scheduled work onto jobs compute, turn on autoscaling with strict auto-termination, shift batch workers to spot instances, and enforce tagging so every dollar traces back to a job. Right-sizing plus a jobs compute migration typically cuts pipeline spend significantly, and spot or commitment strategies compound on top of that. Your first move: export system.billing.usage and rank your top 10 jobs and clusters by DBU and dollar spend before you change anything.
TL;DR:
- Most cost savings come from shifting scheduled work to jobs compute, enabling autoscaling and auto-termination, and using spot instances for batch workloads.
- Proper workload-type matching, right-sizing instances based on CPU and memory metrics, and measuring Photon’s actual speedup ensure optimal compute cost efficiency.
- Tagging workloads with business unit, project, environment, and owner is essential for accurate cost attribution and effective FinOps management.
- Cross-region and cross-cloud data transfers, idle clusters, and unoptimized shuffle-heavy jobs cause unexpected charges and inflate total costs.
- Regular two-week audits and implementing a prioritized savings plan with clear ownership significantly improve ongoing cost control.
Table of Contents
- How do you choose the right Databricks compute for cost efficiency?
- How should you configure autoscaling and auto-termination to cut idle spend?
- How do you monitor and attribute Databricks costs by team?
- What drives the Databricks pricing model and where do surprise charges come from?
- How do you know if Photon actually lowers your Databricks bill?
- What’s a two-week checklist to cut Databricks spend fast?
- What proof backs a Databricks cost audit approach?
- What’s the best strategy for managing Databricks storage costs?
- How does data transfer affect your total Databricks bill?
- What are the best practices for scheduling jobs to reduce idle Databricks compute?
- How should FinOps teams govern Databricks costs over time?
- How can Cost Beacon lower your Databricks and AWS bill?
- Sources
How do you choose the right Databricks compute for cost efficiency?
Every dollar you overspend on Databricks usually starts with a compute mismatch: interactive-dev clusters left running scheduled ETL, or all-purpose compute doing work that jobs compute would do for less. Databricks’ own cost optimization guidance is explicit that matching compute type to workload pattern is the first lever, not an afterthought.
Four compute types cover almost every workload:
- Jobs compute for scheduled ETL and non-interactive pipelines. This is billed at a lower DBU rate than all-purpose clusters and should be the default for anything running unattended.
- SQL warehouses for BI and dashboarding, where Photon is on by default and scale-to-zero behavior matters more than raw throughput.
- All-purpose clusters for interactive development, notebooks, and ad hoc exploration where engineers need a live session.
- Serverless compute for spiky or unpredictable workloads that need to scale to zero between runs, even though the per-DBU rate runs higher.
Right-sizing comes next, and it’s where most teams leave money on the table. Pull CPU, memory, and disk I/O metrics from the cluster’s Ganglia or metrics UI before you touch the instance type. A job that’s memory-bound on an r-family AWS instance gains nothing from more vCPUs; a shuffle-heavy Spark job bound on network throughput needs a different instance family entirely. Standardize on a small set of T-shirt sizes (small, medium, large) tied to instance families, and let engineers pick from that list instead of hand-tuning every cluster.
Photon deserves a separate decision, not a blanket “always on” or “always off” rule. It raises the DBU rate per hour, so it only lowers your total dollar cost when the wall-clock speedup outweighs that multiplier. Databricks recommends treating it as something you measure per workload, not a checkbox you set once. Section 6 below walks through the exact test.
Two operational rules keep this disciplined over time. Reserve GPU instances strictly for ML training and inference workloads that genuinely need them. GPUs sitting idle under a general-purpose cluster are one of the most expensive mistakes a platform team can make, since GPU instance hours cost multiples of standard compute regardless of utilization. And enforce cluster size standards through compute policies rather than tribal knowledge. A policy that caps instance types and worker counts stops one engineer’s “just in case” cluster from becoming a permanent line item.
Pro Tip: Before you approve any new cluster policy, check its default node type against your instance family standards. A default that quietly ships an r5.4xlarge instead of your approved r5.2xlarge will double compute cost on every job that inherits it, and nobody will notice until the monthly bill lands.
How should you configure autoscaling and auto-termination to cut idle spend?
Idle compute is the single most common source of wasted Databricks spend, and it’s almost entirely a configuration problem, not a workload problem. Get autoscaling, auto-termination, pools, and spot instances set correctly, and idle billing largely disappears on its own.
- Set autoscaling min/max deliberately. A wide max threshold invites overshoot, since Spark will happily scale up to handle a transient spike and then take its time scaling back down. Set max close to what the workload actually needs at p95 load, not what it might theoretically need once a year. For streaming workloads with uneven throughput, enhanced autoscaling reacts faster to queue depth and avoids the lag that causes standard autoscaling to overprovision.
- Enforce auto-termination on every cluster. An idle window of 15 to 30 minutes is the common default for development clusters; anything longer just pays for engineers stepping away from their laptop. For business-hours workloads, scheduled start and stop beats relying on idle timeout alone, since it guarantees the cluster isn’t running overnight even if a session gets left open.
- Use pools where cluster start time matters. Pools keep a set of idle instances ready so clusters attach instantly instead of waiting on a cloud provider to provision new nodes. That reduces the DBU-free but still billed cloud-infra cost of cold starts, though idle pool instances themselves accrue instance charges, so size the pool to actual startup demand.
- Put spot instances on workers, not drivers. Run the driver on-demand for stability and workers on spot for the bulk of the compute cost. Build retry logic and checkpointing into the job so a spot eviction mid-run costs you a few minutes of reprocessing, not a failed pipeline.
Pro Tip: If you run enhanced autoscaling on a streaming job and still see overshoot, check whether your trigger interval is too aggressive. A one-second micro-batch trigger on a workload that doesn’t need sub-minute latency forces the autoscaler to react to noise instead of real load.
How do you monitor and attribute Databricks costs by team?
You can’t optimize what you can’t attribute, and attribution starts with tags applied before usage happens, not after. Microsoft’s Azure Databricks guidance makes a point worth repeating: tags cannot be applied retroactively to past usage, so the cost of waiting to tag is permanent blind spots in your billing history.
Four tags cover most FinOps chargeback needs:
business_unit— the org or department the workload belongs toproject— the specific pipeline, dashboard, or model it supportsenvironment— production, staging, or dev, so idle dev spend doesn’t hide inside production numbersowner— the engineer or team accountable for the workload’s cost trend
These tags propagate directly into system.billing.usage, which is where actual cost analysis happens. Query it alongside system.billing.list_prices to convert raw DBU counts into dollar figures, and join against job run timelines to see cost per individual job run rather than a cluster-level average that hides which jobs are actually expensive. This system-tables approach is what Databricks’ own best practices treat as the source of truth for cost measurement, ahead of any third-party dashboard.
Budgets and alerts close the loop. Set DBU and dollar thresholds per business unit inside the account console’s cost management tooling, and wire those alerts into the same incident workflow your team already uses for production issues, not a separate spreadsheet nobody checks. A budget that exists only as a dashboard nobody opens isn’t a budget.
The behavior behind most invoice surprises isn’t the rate card. It’s idle time, autoscaling overshoot, and retries piling up unnoticed, which is exactly what tagging and system-table queries expose. Build a dashboard that shows cost by workload, owner, and model-serving endpoint, and use it to rank optimization tickets by dollar impact rather than by whoever complains loudest.
What drives the Databricks pricing model and where do surprise charges come from?
Databricks bills you twice, and most budget overruns come from forecasting only one of those bills. You pay Databricks for DBUs (Databricks Units, the compute-time metric behind every cluster and warehouse), and you pay AWS separately for the EC2 instances, EBS storage, and network transfer underneath them. CloudZero’s breakdown of Databricks pricing notes that teams commonly under-budget because they model the DBU line and forget the cloud infrastructure line entirely, even though it can rival or exceed the DBU charge itself.
The per-DBU rate isn’t flat. It varies by compute type (jobs compute cheaper than all-purpose), by tier (Standard versus Premium versus Enterprise), and by cloud region. Pricing breakdowns show jobs compute sitting at the low end of the per-DBU scale, with serverless priced higher per unit but often cheaper in total for spiky workloads because it scales to zero between runs.
Watch for these behaviors, which cause more surprise charges than the rate card itself:
- Autoscaling overshoot from a max threshold set too generously
- Idle clusters left running past their actual work window
- Photon’s DBU multiplier applied to a workload where it doesn’t speed anything up
- Retries and job failures that silently rerun the same compute-hours
- Data egress charges from cross-region or cross-cloud transfers
Buy a commitment sized to your trailing three-month baseline, not your best month, and revisit it quarterly rather than locking in a year ahead based on a single spike.
How do you know if Photon actually lowers your Databricks bill?
Photon’s marketing pitch is speed. Its actual cost impact depends entirely on whether that speed outruns its higher DBU rate, and LakeSentry’s analysis of Photon’s tradeoffs is blunt about it: you have to measure this per workload, because the answer varies job by job.
- Pull three numbers per job: DBUs consumed, wall-clock runtime, and dollar cost (DBUs times the list price for that compute type). All three live in
system.billing.usagejoined againstsystem.billing.list_prices. - Check the SQL profile or Spark UI for operator-level red flags. Python UDFs and I/O-bound stages commonly cause Photon to fall back to standard execution, which means you pay Photon’s higher rate without getting Photon’s speedup. QueryPlane’s review of Photon in production flags UDF-heavy jobs as the most common source of this silent cost leak.
- Run the same job twice, Photon on and Photon off, and compare total dollar cost, not just runtime. A 2× runtime improvement roughly breaks even against Photon’s DBU premium; you want to see north of 2.5× before calling it a clear win on classic clusters.
- Default Photon on for Databricks SQL warehouses and Parquet or Delta table scans, where it’s on by default for good reason, and treat classic all-purpose or jobs clusters as a case-by-case test.
Pro Tip: *Run the A/B test on your three highest-dollar jobs first, not your most technically interesting ones.
What’s a two-week checklist to cut Databricks spend fast?
You don’t need a quarter-long FinOps initiative to find your biggest savings. Two weeks, done in this order, gets you a prioritized plan with dollar estimates attached.
- Days 1 to 2: export
system.billing.usageand rank every job and cluster by DBU and dollar spend. Your top 10 line items are almost always where the majority of controllable spend lives. - Days 3 to 7: apply the quick wins to those top 10: enforce auto-termination, migrate scheduled jobs off all-purpose onto jobs compute, and move worker nodes on batch jobs to spot instances.
- Days 8 to 11: A/B test Photon on candidate jobs and right-size instances against your T-shirt sizing policy for anything still running oversized.
- Days 12 to 14: package the results into a prioritized savings plan with an estimated dollar impact and a named owner per item.
| Action | Typical timeframe | What it targets |
|---|---|---|
| Export and rank system.billing.usage | Days 1 to 2 | Identifies top spenders by DBU and dollar |
| Auto-termination and jobs compute migration | Days 3 to 7 | Idle time and compute-type mismatch |
| Spot instances on batch workers | Days 3 to 7 | Underlying AWS infra cost |
| Photon A/B test and right-sizing | Days 8 to 11 | DBU multiplier waste and oversized instances |
| Prioritized savings plan delivery | Days 12 to 14 | Ownership and forecasted dollar impact |
What proof backs a Databricks cost audit approach?
This is exactly the sequence Cost Beacon runs for clients, minus the internal debate over which job to check first. Our audit method pairs AI-driven analytics that scan system.billing.usage and cloud billing exports at scale with hands-on engineers who verify every recommendation against the actual workload before it goes into a client’s plan.
A few things about how we work matter here:
- We only get paid when you realize the savings, so there’s no incentive to recommend changes that look good on paper but don’t hold up in production.
- Every recommendation ships with an estimated dollar impact and an owner, the same format the two-week playbook above produces.
- The audit surfaces security gaps alongside cost leaks, since misconfigured clusters and overspending often share the same root cause: no policy enforcement.
What’s the best strategy for managing Databricks storage costs?
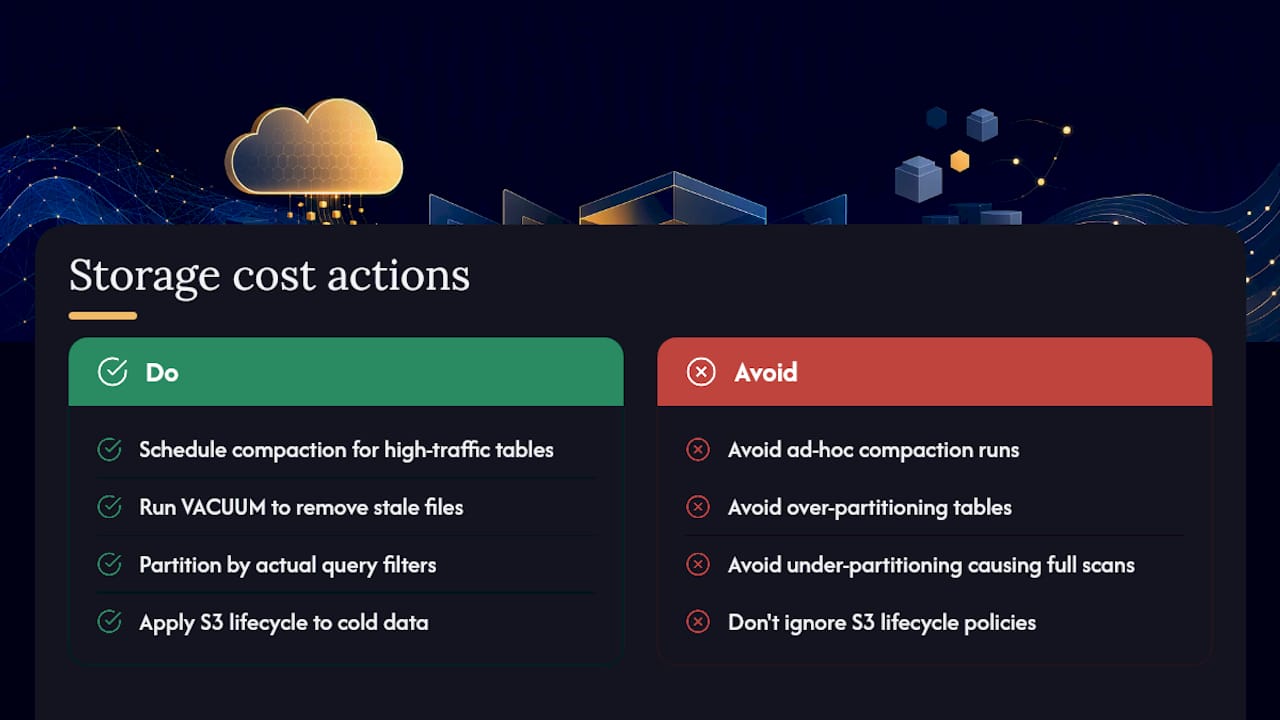
Storage costs on Databricks are mostly a Delta Lake table management problem, not a raw storage-tier problem. Small files accumulate fast from streaming writes and frequent merges, and every one of them adds read overhead and metadata cost even before you account for the underlying S3 storage charge.
Run OPTIMIZE on high-traffic tables on a schedule, not ad hoc, to compact small files into larger ones that scan faster and cost less to read repeatedly. Pair it with VACUUM to remove stale data files past your retention window, since Delta’s time-travel feature keeps old versions around by default and that unused history quietly adds up in S3 storage charges.
Partition strategy matters more than most teams expect. Over-partitioning creates thousands of small files per partition, which inflates both storage overhead and job planning time. Under-partitioning forces full-table scans on filtered queries. Match partition columns to actual query filter patterns, not to whatever column looked convenient at table creation time.
Finally, apply S3 lifecycle policies to move cold Delta table data to Infrequent Access or Glacier tiers once it’s outside your active query window. This is a cloud-storage decision independent of Databricks itself, but it directly reduces the underlying AWS bill that shows up alongside your DBU charges every month.
How does data transfer affect your total Databricks bill?
Network charges are the line item most FinOps reviews miss entirely, because they don’t show up in DBU counts at all. They show up on the AWS bill, separately, often weeks after the compute cost that caused them.
Cross-region reads are the biggest offender. A cluster running in us-east-1 querying a data lake bucket in us-west-2 pays cross-region transfer charges on every scan, on top of the added latency. Keep compute and storage in the same AWS region as a hard rule, enforced through compute policy if necessary, not just documentation.
Cross-cloud egress compounds the problem for teams running multi-cloud architectures. Pulling data from a GCP bucket into an AWS-hosted Databricks workspace, or the reverse, incurs egress charges on the source cloud that have nothing to do with Databricks pricing at all. If a workload doesn’t need to cross clouds, don’t let it.

Shuffle-heavy Spark jobs generate internal network traffic between worker nodes, which doesn’t show up as a separate line item but does show up as extra runtime, and extra runtime is extra DBU cost. A job with excessive shuffle from a poor partition strategy or a skewed join key pays for that network overhead in compute minutes, not a transfer fee.
What are the best practices for scheduling jobs to reduce idle Databricks compute?
Idle compute rarely comes from bad workloads. It comes from bad scheduling: jobs staggered wide, clusters spun up early and left running, or dependencies chained in a way that forces one job to wait on another with a cluster idling in between.
Cluster reuse across jobs is the single biggest lever here. If three ETL jobs run sequentially each morning, running them on one shared jobs-compute cluster instead of spinning up three separate clusters eliminates redundant startup time and the idle gap between runs. Databricks Workflows supports this pattern natively through job clusters shared across tasks.
Stagger job start times based on actual data availability, not a round schedule that looks tidy on a calendar. A job scheduled for 2:00 AM that then waits 40 minutes for upstream data to land is paying for 40 minutes of idle cluster time it didn’t need to buy. Trigger-based scheduling, kicked off when upstream data actually lands, closes that gap.
Batch similar-size jobs together rather than interleaving small and large workloads across the same time window. Small jobs waiting behind a large job’s cluster warm-up time waste minutes that add up fast across a daily schedule running dozens of pipelines.
How should FinOps teams govern Databricks costs over time?
Cost optimization decays without a cadence. Run a monthly review with two fixed artifacts: a cost leaderboard ranked by DBU and dollar spend, and an action backlog tracking every open optimization ticket by owner and estimated impact.
Assign three roles explicitly: a cost owner per business unit who reviews the leaderboard, a platform engineer who maintains compute policies and pools, and a FinOps analyst who owns the system-tables pipeline feeding both. Track DBU per workload, dollar per inference for model-serving endpoints, and autoscaling overshoot rate as your three core metrics. Teams that skip the overshoot metric consistently underestimate how much their autoscaling max thresholds are costing them.
— Aaditya Parashar
How can Cost Beacon lower your Databricks and AWS bill?
Running the audit above internally takes real engineering hours you’re probably not staffed for, and most teams find the highest-value fixes only after the bill has already spiked. Cost Beacon runs this exact process for you, pairing AI-driven analysis of your system.billing.usage and AWS billing exports with engineers who verify every recommendation before it lands in your plan.
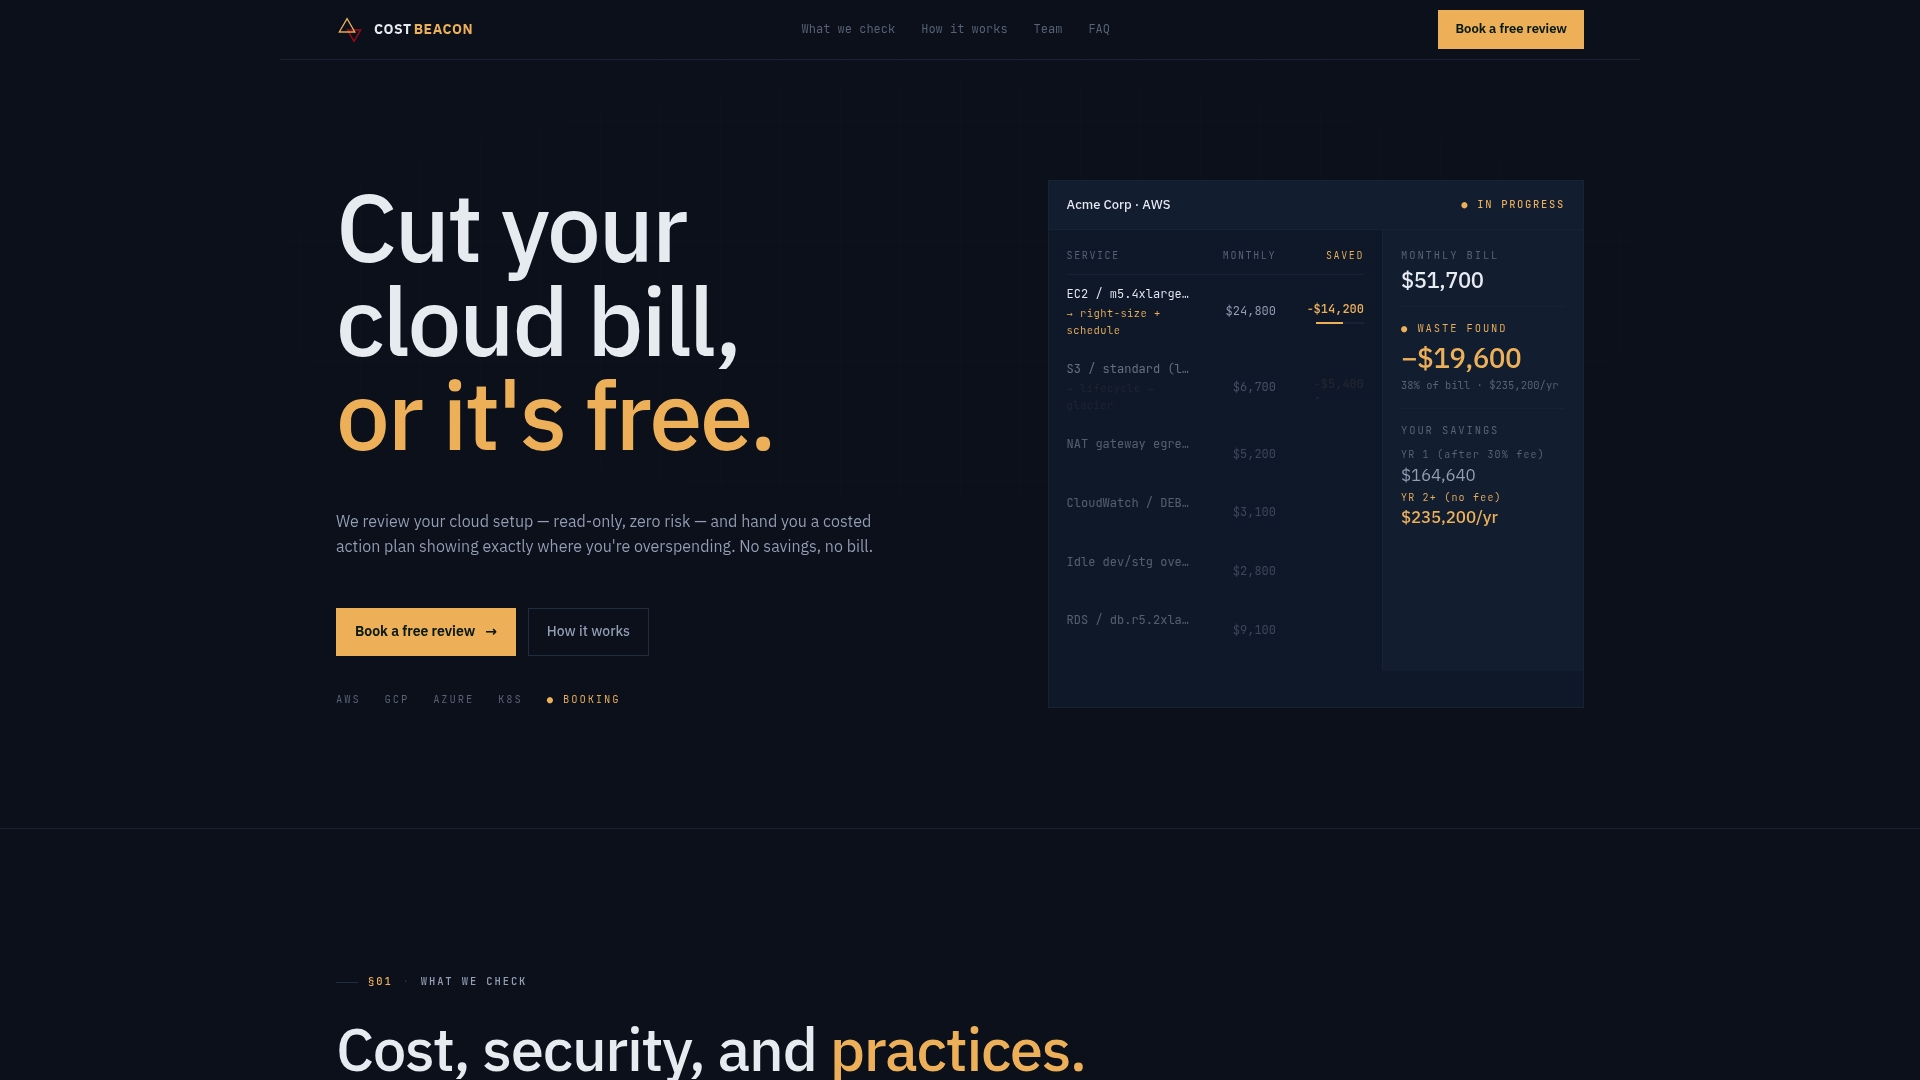
The engagement delivers a prioritized savings plan with a dollar estimate and owner attached to every item, the same structure as the two-week checklist above, plus optional implementation support if you’d rather have us execute the fixes than hand them off. Schedule a cloud cost and security review with Cost Beacon and get your prioritized savings estimate before you commit to anything.
Sources
Aaditya works on cloud cost and platform engineering at Cost Beacon, mostly on AWS and Kubernetes estates that grew faster than anyone planned for.
 Cost Beacon