Cloud unit economics measures what it costs you to deliver one unit of value, whether that unit is a customer, a transaction, or an API call, and it turns a rising AWS bill into a business signal instead of a red flag. The FinOps Foundation frames it as the discipline that connects cloud spend to business outcomes, and it’s built around three core metrics you need on a dashboard before you touch a single instance.
Unit cost is your baseline: total relevant cloud spend divided by a business unit like active users or orders processed. Cloud efficiency rate (CER) compares cost to revenue, showing whether spend is scaling faster or slower than the money coming in. Effective Savings Rate (ESR) measures how much return you’re actually getting from reserved instances, savings plans, and other discount commitments, calculated against on-demand equivalent (ODE) spend.
Getting these three numbers right requires real billing and usage data, not guesswork. Because this practice leans heavily on AWS Cost and Usage Reports and the AWS Cost Explorer CLI for the ODE data ESR requires, the implementation guidance ahead is written from an AWS-first perspective, with notes on Azure and GCP where the concepts translate.
Quick stat: Benchmarks compiled around ESR calculations show many organizations land near a 0% effective savings rate, while top performers in the same data reach roughly 46% at the 98th percentile, a gap that usually comes down to never comparing discounted spend against its on-demand baseline.
Key Takeaways
Cloud unit economics turns your AWS bill into a business metric by measuring unit cost, CER, and ESR against a clearly defined business unit, and every calculation depends on trustworthy billing and telemetry data.
| Point | Details |
|---|---|
| Start with one metric | Pick a single unit metric both finance and engineering agree matters before building any dashboard. |
| ESR needs ODE data | Calculate Effective Savings Rate using AWS Cost Explorer API/CLI data, since standard dashboards don’t expose ODE spend. |
| Tag your top spenders first | Enforce tagging on the largest services by spend to get usable unit cost data within weeks. |
| Run sensitivity scenarios quarterly | Model volume, architecture, and commitment changes against your unit cost baseline before making major decisions. |
| Audit before you build | Cost Beacon’s pay-on-savings review finds idle resources and oversized instances that lower unit cost immediately, with no upfront fee. |
Table of Contents
- What do unit cost, CER, and ESR actually mean?
- How do you calculate unit cost, CER, and ESR?
- What data and telemetry do you actually need?
- How does unit economics inform pricing and forecasting?
- How do you roll out cloud unit economics in one quarter?
- What does a real-world cloud cost audit uncover?
- How does unit economics change your competitive position?
- How do you run sensitivity analysis on cloud unit costs?
- How does unit economics fit with broader financial KPIs?
- What benchmarks exist for cloud unit economics?
- Which tools handle unit economics beyond AWS?
- Where should teams focus first as they scale this?
- How can a cloud cost audit speed up your unit economics program?
- Sources
What do unit cost, CER, and ESR actually mean?
Before any team can compare notes across engineering and finance, everyone needs to agree on what the numbers mean. That shared vocabulary is the real starting point of cloud unit economics, more than any dashboard or tool.
A unit metric is the business activity you’re measuring cost against. It has to be something both engineering and finance recognize as meaningful:
- SaaS: cost per active user, per seat, or per tenant
- Fintech: cost per transaction processed, per account, or per fraud check run
- E-commerce: cost per order, per checkout session, or per SKU indexed
- Internal platforms: cost per build, per deployment, or per API call served
Unit cost is simply total relevant cloud spend for a period divided by the count of that unit. If your compute, storage, and data transfer costs for a service totaled $40,000 last month and you processed 200,000 transactions, your unit cost is $0.20 per transaction. Marginal cost is a narrower cousin: the cost of the next unit, which matters more when you’re deciding whether scaling from 200,000 to 400,000 transactions doubles your bill or barely moves it.
Cloud efficiency rate (CER) expresses cost as a share of revenue, often shown as cost per dollar of revenue. Falling CER over time, even with total spend rising, usually signals healthy growth rather than waste, since Datadog’s analysis shows unit cost dropping as volume climbs is exactly what efficient scaling looks like.
Effective Savings Rate (ESR) is different from the other two. It’s not a cost-per-unit metric at all. It’s the ROI on your discount instruments, measuring how much of your potential on-demand cost you actually avoided through reserved instances, savings plans, or committed-use discounts. ESR matters most when you’re deciding whether your finance team’s commitment strategy is actually working or just adding complexity.
One practical note: when comparing measurement approaches across teams, describe them by category (spend-based tracking, usage-based tracking, commitment-based tracking) rather than by vendor name. That keeps the conversation about method, not tooling politics.
How do you calculate unit cost, CER, and ESR?

Every one of these calculations depends on data you likely already have, just not in the form you need it. Here’s how to turn AWS billing exports into numbers finance and engineering can both use.
Step 1: Gather your inputs. You need four things:
- Billing data, ideally an AWS Cost and Usage Report (CUR), broken down by service and, where possible, by tag
- Usage logs or application telemetry showing the count of your chosen unit (users, transactions, orders)
- On-Demand Equivalent (ODE) spend, meaning what you would have paid without any reserved instances or savings plans
- The cost to achieve savings, covering any tooling, automation, or staff time spent managing commitments
Step 2: Calculate unit cost. Divide total relevant spend by unit count for the same period. If your CUR shows $58,000 in compute and database costs for March, and your application logs show 145,000 orders processed, unit cost is $0.40 per order.
Step 3: Calculate CER. Divide the same spend figure by revenue for that period.
Step 4: Calculate ESR. This one requires the ODE figure. The formula, per FinOps Foundation guidance, is:
ESR = (savings generated − cost to achieve savings) / ODE spend
Say your ODE spend (what you’d pay at full on-demand rates) was $100,000. Your actual bill, after reserved instance discounts, came to $68,000, meaning you saved $32,000. But you spent $2,000 on a third-party commitment management tool and internal review time to manage that RI portfolio. Your net savings is $30,000.
For shared resources, like a Kubernetes cluster running workloads for three product lines, allocate costs proportionally to a usage signal you already track, such as CPU-hours or request volume per namespace. It won’t be perfect, but a consistent proportional method beats an arbitrary even split three ways.
One data caveat worth flagging early: standard AWS Cost Explorer dashboards don’t surface ODE spend directly. You’ll need the AWS Cost Explorer API or CLI to pull the on-demand comparison data ESR depends on.
What data and telemetry do you actually need?
Unit economics calculations are only as good as the data feeding them, and most teams discover gaps the first time they try to run the numbers for real.
At minimum, you need three data sources working together:
- AWS Cost and Usage Reports (CUR) or billing API exports, ideally tagged by service, environment, and team
- Application telemetry: events, traces, or logs that count the actual units (signups, transactions, API calls) tied to that spend
- Resource-level usage metrics, such as instance utilization or database query volume, to support allocation decisions for shared infrastructure
When telemetry is incomplete, which happens often on legacy services or newly acquired products, you have workable fallbacks. Microsoft Learn’s FinOps guidance recommends starting with the telemetry you have and layering in API management metrics or monitoring-tool alerts (Azure Monitor is the example given, though the pattern applies to CloudWatch on AWS too) as a stopgap. Synthetic metrics, like estimating transaction counts from queue depth or request logs, can bridge the gap while you build proper instrumentation.
Tagging discipline makes or breaks this entire exercise. A resource without a cost-center or product tag is a resource you can’t map to a unit, full stop. Build your tagging taxonomy around three fields at minimum: product or service name, environment (production, staging, dev), and owning team. Enforce it with AWS Config rules or a tag-compliance scan run weekly, not annually.
For integration, most teams pipe CUR data into a warehouse (Snowflake, BigQuery, or Redshift) and join it against application event tables using a shared identifier like account ID or request ID.
That handful of resources usually accounts for the majority of your bill, and getting them tagged correctly gets you usable unit economics data within weeks instead of waiting for a company-wide tagging mandate to finish.*
How does unit economics inform pricing and forecasting?
Once you trust your unit cost and CER numbers, they stop being a reporting exercise and start driving real decisions across finance, product, and engineering.
Setting targets and monitoring them starts with picking a realistic baseline, not an aspirational one. If your current unit cost is $0.40 per order, don’t set a target of $0.15 in one quarter.
Forecasting becomes far more reliable once you have a stable unit cost figure, because you can multiply it by projected volume instead of extrapolating a noisy total-spend trend line. According to Datadog’s guidance on cloud unit economics, teams that model cost-per-unit against expected business volume catch scaling problems (like a database that gets proportionally more expensive at high concurrency) months before they show up as a budget overrun.
Pricing decisions get sharper too.
Governance matters as much as the math. A few structural choices determine whether this program survives past the first quarter:
- Assign a named owner for each unit metric, usually a FinOps lead or engineering manager, not a shared team inbox
- Decide between showback (reporting costs to teams for awareness) and chargeback (actually billing teams internally), and don’t blend the two without being explicit about it
- Set a recurring review cadence, monthly at minimum, with finance and engineering both present
- Revisit unit metric definitions quarterly as the product evolves, rather than trying to get them perfect on day one
- Treat unit economics reviews as a standing agenda item, not a special project
- Give engineering visibility into the revenue side, not just the cost side, so CER conversations land
How do you roll out cloud unit economics in one quarter?
You don’t need a company-wide mandate to start. A focused, time-boxed rollout on one product line proves the model works before you scale it.
- Weeks 0 to 2: Pick one product or service and one unit metric that finance and engineering both agree matters, whether that’s cost per active user or cost per transaction. Validate that your telemetry can actually count that unit today. Assign an owner for the metric before you write a single query.
- Month 1: Pull CUR data into your warehouse and connect it to AWS Cost Explorer for validation. Build a basic mapping between tagged resources and your chosen unit, then compute your baseline unit cost and CER. Put both numbers on a dashboard the relevant team actually looks at weekly.
- Quarter 1: Run your first ESR calculation for any reserved instance or savings plan commitments tied to that service, pulling ODE data through the Cost Explorer API. Set a realistic improvement target for unit cost and CER. Automate the reporting so it refreshes without manual pulls, and set an alert threshold for when unit cost drifts more than 10% in a week.
- Ongoing: Revisit your metric definitions every quarter, not because they were wrong but because the product changes. As confidence grows, automate cost allocation further and connect the outputs to procurement conversations, especially before renewing any reserved instance or savings plan commitment.
Multiple implementation guides, including Ternary’s rollout framework, converge on the same lesson: start with one metric, automate what you can early, and resist the urge to build a perfect allocation model before you’ve proven the simple version delivers value.
Pro Tip: Run your first ESR calculation on your single largest reserved instance commitment, not your entire portfolio. A focused number you can defend in a finance meeting beats a company-wide average that hides which specific commitments are actually underperforming.
What does a real-world cloud cost audit uncover?
Numbers on a dashboard mean little until someone acts on them. That’s the gap between measuring unit economics and actually improving it, and it’s where a structured audit earns its keep.
Cost Beacon’s approach pairs AI-driven analysis of billing and usage data with hands-on engineering review, the kind of manual inspection that catches what automated anomaly detection tends to miss: an oversized RDS instance provisioned for a launch spike that never got resized, or a fleet of idle EC2 instances left running after a migration.

What this means for your unit cost math: every idle resource or oversized instance you eliminate drops straight into your unit cost numerator with no corresponding change to your unit count, meaning cost per transaction or cost per user improves immediately.
The engagement model matters as much as the findings. Cost Beacon operates on a pay-on-savings basis: no upfront fee, and the fee is a percentage of savings actually realized. For a FinOps team trying to get budget sign-off, that structure removes the usual procurement friction of justifying a consulting spend before results exist.
How does unit economics change your competitive position?
Companies that measure unit economics well don’t just cut costs. They make different product decisions than competitors flying blind on cloud spend.
When you know your cost per transaction precisely, you can price a new tier with confidence instead of guessing at margin. You can also decide to subsidize a loss-leading feature deliberately, because you know exactly how much it costs and why, rather than discovering the loss months later in a finance review. That’s the strategic layer the FinOps Foundation points to when it frames unit economics as more than a cost-cutting checklist: it’s a way to align engineering architecture choices with where the business actually makes money.
Competitive advantage shows up in speed, too. A team with mature unit cost visibility can greenlight a new feature or market expansion in days, because the cost model already exists. A team without it has to build a one-off cost estimate for every major decision, which slows product velocity and often produces a worse estimate anyway.
There’s a defensive angle as well. If a competitor can operate at a materially lower cost per user, they can undercut your pricing and still turn a profit, while you can’t match that price without losing money. Unit economics is how you find out whether that’s a real risk or a theoretical one, well before a pricing war forces the question.
The businesses that treat this as a quarterly discipline, not an annual finance exercise, tend to spot both the opportunity and the threat earlier than everyone else in their market.
How do you run sensitivity analysis on cloud unit costs?
A single unit cost number tells you where you stand today. Sensitivity analysis tells you what happens when the assumptions underneath that number shift, and that’s usually the more useful conversation with finance.
Start with the variables most likely to move: transaction volume, architecture changes (a database migration, a shift to serverless), and pricing changes from your cloud provider. Model three scenarios for each, not just best and worst case, but a realistic middle scenario your team actually expects.
For volume sensitivity, ask what happens to unit cost if transaction volume doubles without any architecture change. Some costs scale linearly (data transfer, storage), while others have step-function jumps (a database tier upgrade, an added availability zone). Mapping which cost lines are linear versus stepped tells you exactly where your next scaling bottleneck will hit your unit cost, before it happens.
For architecture sensitivity, model the unit cost impact of a planned change before you build it. If a team is proposing a move from a single large RDS instance to a distributed data store, run the unit cost math on projected usage under both architectures. That single exercise has killed more than one migration that looked good on a whiteboard but made unit economics worse.

For commitment sensitivity, model how a new reserved instance or savings plan purchase changes your ESR under different future usage scenarios. A three-year commitment that looks great at current volume can turn into a drag on ESR if usage drops, since you’re still paying for capacity you’re not using.
Build these scenarios in a simple spreadsheet tied to your unit cost baseline, updated quarterly alongside your regular metric review.
How does unit economics fit with broader financial KPIs?
Cloud unit economics doesn’t work as a metric that lives only in engineering’s dashboard. It has to connect to the KPIs finance already tracks, or it stays a side conversation nobody outside FinOps pays attention to.
The clearest connection point is gross margin. If finance tracks gross margin by product line, cloud unit cost is very likely one of the biggest inputs to that number for any digital product. Feeding your unit cost and CER data directly into the gross margin calculation, rather than keeping it in a separate cloud cost report, gets cloud spend treated as a margin lever instead of a fixed overhead line.
Customer acquisition cost (CAC) and lifetime value (LTV) models benefit too. If your cost per active user is climbing while CAC stays flat, that’s a signal that LTV to CAC ratios are quietly eroding, even if the top-line revenue number still looks healthy.
Budget variance reporting is another natural fit.
Practically, this means the person or team responsible for unit economics reporting needs a seat in the same budget review cycle as the rest of financial planning, not a separate quarterly readout that finance sees weeks later. Building unit cost and CER into the same reporting cadence and the same dashboard tooling finance already trusts is what turns this from an engineering side project into a number the CFO actually cites.
What benchmarks exist for cloud unit economics?
Benchmarks for cloud unit economics are less standardized than something like gross margin, mostly because unit definitions vary so much by business model. A cost-per-transaction benchmark for a payments company means nothing to a media streaming platform measuring cost-per-stream-hour. That said, a few benchmark patterns are consistent enough to use as a sanity check.
ESR is the exception, with the most concrete published benchmark data. FinOps Foundation research on effective savings rate shows a wide spread: many organizations report an ESR near 0%, meaning their discount commitments are barely outperforming on-demand pricing, while top performers reach around 46% at the 98th percentile.
For unit cost and CER specifically, the more useful benchmark is your own trend line rather than an external number. Track CER quarter over quarter and treat any month where it rises faster than 2 to 3 percentage points as worth investigating, regardless of what a competitor’s published CER might be. Cross-industry unit cost comparisons are rarely apples to apples once you account for differences in architecture, region mix, and product complexity.
The FinOps Framework itself, as the industry body most focused on this discipline, treats maturity in unit economics reporting as a marker of an organization moving from “crawl” to “walk” to “run” stages of cloud financial management, which is a more actionable benchmark than any single external percentage.
Which tools handle unit economics beyond AWS?
AWS Cost Explorer and its CLI cover the AWS side of this equation well, but most organizations run workloads across more than one cloud, and the tooling landscape reflects that.
Microsoft Azure’s cost management tools follow a similar pattern to AWS, with Azure Cost Management and Azure Monitor providing the billing and usage telemetry needed for unit cost calculations. Microsoft’s own FinOps guidance treats unit economics as a core practice, and its recommendation to lean on Azure Monitor as a telemetry fallback mirrors the CloudWatch pattern AWS users already know.
Google Cloud Platform offers its own native billing export and BigQuery integration, which in practice makes GCP one of the easier platforms for building custom unit economics dashboards, since billing data lands directly in a queryable warehouse without extra pipeline work.
Beyond the three major cloud providers, observability platforms like Datadog layer unit economics reporting on top of existing monitoring data, letting teams correlate cost with performance metrics they’re already tracking rather than standing up a separate cost pipeline. For teams running Kubernetes across multiple clouds, open-source tools focused on cost allocation at the namespace and pod level fill a gap none of the native cloud billing tools handle well.
The practical reality for most FinOps teams: pick the native tool for your primary cloud as the system of record, and use a cross-cloud layer only when multi-cloud spend is significant enough to justify the added complexity. Comparing tool categories, native billing consoles, cross-cloud cost platforms, and observability add-ons, matters more than comparing individual products, since the right choice depends heavily on how many clouds you actually run.
Where should teams focus first as they scale this?
The biggest mistake teams make with cloud unit economics is trying to measure everything at once. Pick one metric that finance and engineering both already care about, prove it works, and only then add a second. Metrics should evolve as the product does, not multiply because someone requested a new dashboard view.
Watch for three failure modes as programs mature. First, engineering incentives that reward cutting cost without regard for the unit metric, which leads to decisions that shrink the bill but also shrink the product’s ability to scale. Second, chasing perfectly precise cost allocation on shared resources when a reasonable proportional method would have been good enough months ago. Third, over-committing to reserved instances or savings plans in a way that looks good on paper but actually drags down ESR the moment usage patterns shift.
Where this goes next: expect unit metrics to move closer to real time, and expect finance teams to demand tighter integration between unit economics data and actual pricing decisions, not just retrospective reporting.
How can a cloud cost audit speed up your unit economics program?
Building unit cost and CER dashboards from scratch takes months of tagging cleanup, telemetry work, and cross-team alignment before you see a usable number. Cost Beacon shortens that path by finding the cost leaks feeding your unit cost numerator right now, idle resources, oversized instances, unused reserved capacity, before you’ve even finished building the measurement pipeline.
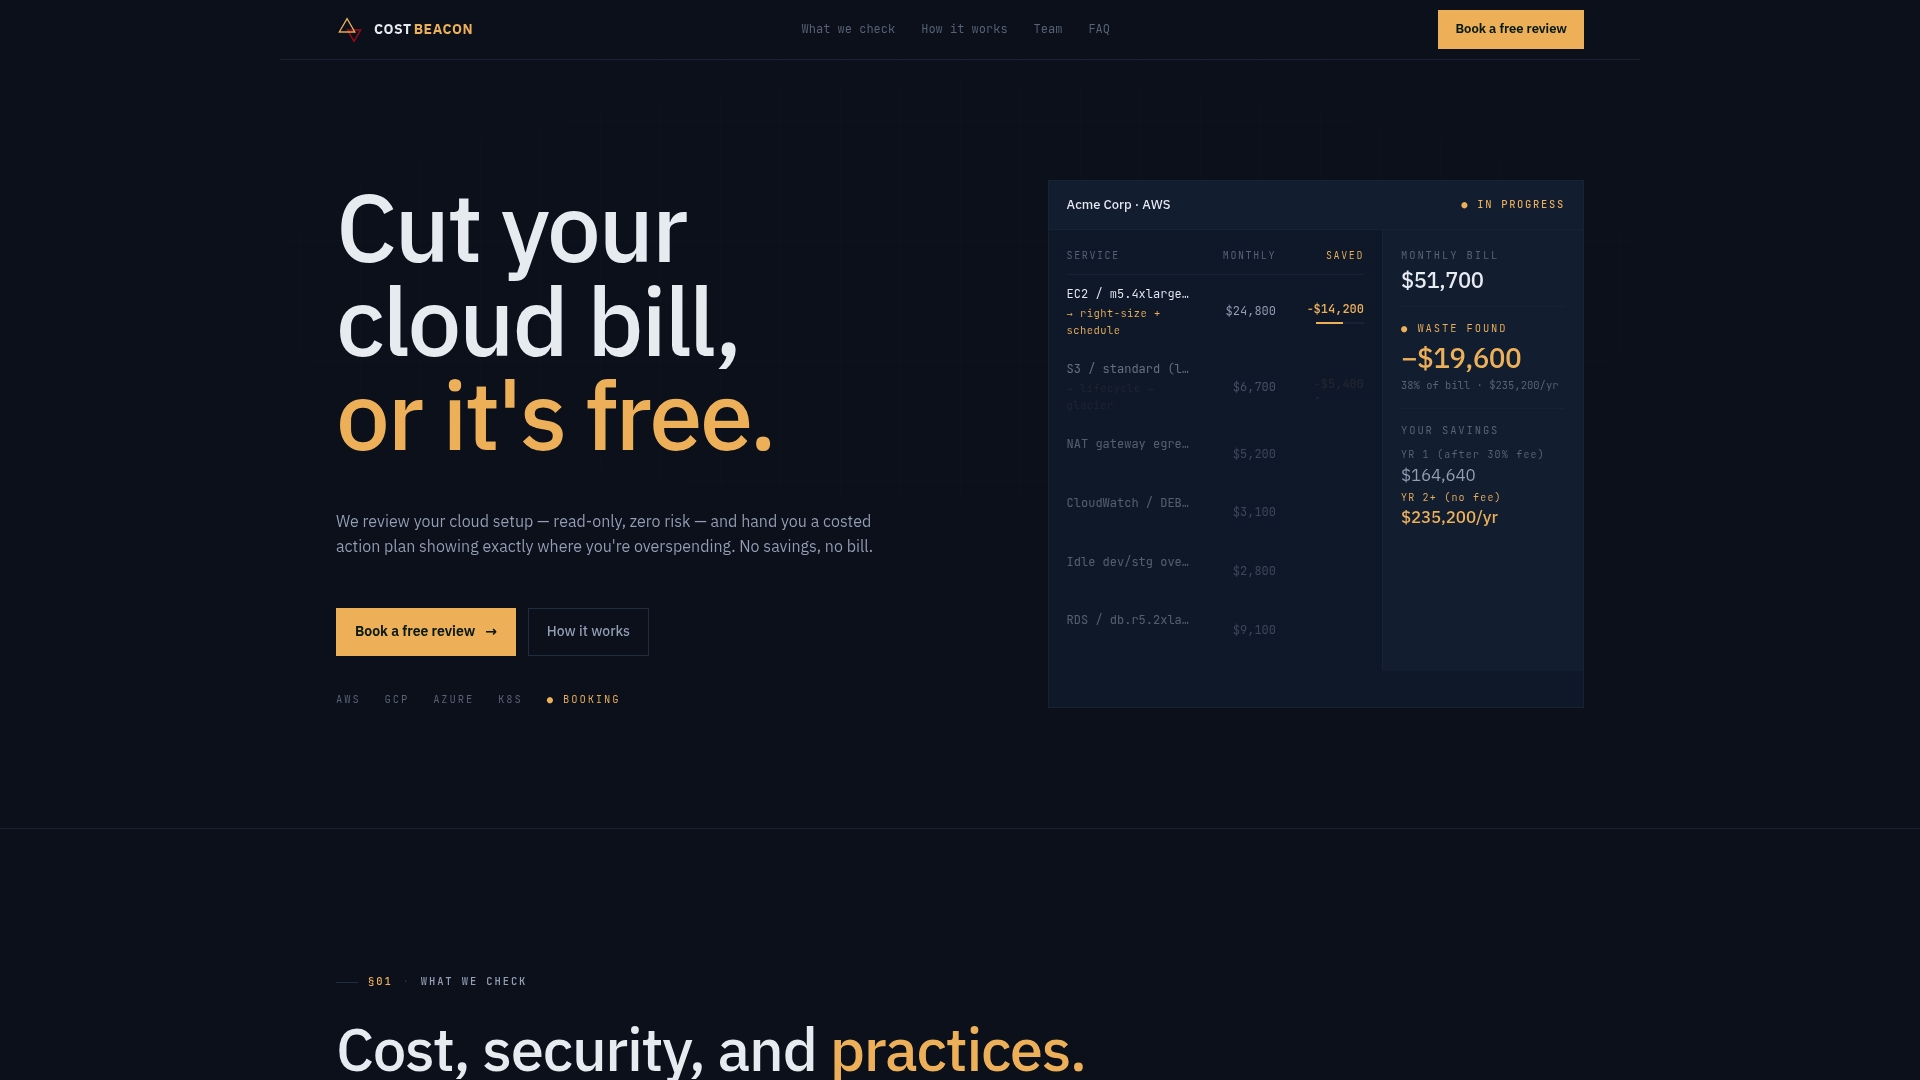
The audit combines AI-driven analysis of your billing and usage data with hands-on engineering review across AWS, Azure, GCP, and Kubernetes environments, and it delivers a prioritized action plan showing expected savings per item, along with any security issues the review turns up along the way. Every finding gets tied to a specific resource, so your team can drop the results directly into the tagging and allocation work your unit economics program already needs.
Because Cost Beacon works on a pay-on-savings basis, with no upfront fee and a charge based only on realized savings, there’s no budget approval hurdle to clear before getting started. If you’re building a business case for a unit economics program, a cloud cost and security review gives you both a lower baseline unit cost to start from and concrete proof points for the finance conversation. Getting an initial assessment scoped typically takes a short intake call to confirm which environments and accounts to review.
Sources
- Introduction to Cloud Unit Economics - FinOps Foundation
- Unit economics - Cloud Computing | Microsoft Learn
- A guide to cloud unit economics | Datadog
Recommended
Aaditya works on cloud cost and platform engineering at Cost Beacon, mostly on AWS and Kubernetes estates that grew faster than anyone planned for.
 Cost Beacon