Cloud spend analysis explains why your bill moved, finds prioritized savings you can act on this week, and tightens forecast accuracy for the next budget cycle. It’s built for FinOps leads, finance controllers, and cloud platform teams who need answers, not another dashboard. Done well, it turns a wall of billing line items into a ranked list of fixes with dollar amounts attached.
TL;DR:
- Over 80% allocation coverage is essential for credible spend attribution to individual teams or projects, or else reports lose reliability.
- Regularly measuring commitment utilization and amortized effective rate over 90 days helps identify idle capacity and true cost savings, avoiding snapshot distortions.
- Native cloud tools provide detailed billing data, but multi-cloud environments and workflow automation typically require dedicated FinOps platforms.
- Converting findings into actionable savings relies on detailed cards with estimated impact, effort, risk, and responsible owners, prioritized by impact-to-effort ratio.
- Automated governance, budgets, and showback or chargeback practices are critical to sustaining identified savings and preventing cost regress.
Table of Contents
- What is cloud spend analysis?
- What metrics and KPIs actually measure spend analysis quality?
- Where does the data for cloud bill analysis come from?
- How do you run a repeatable cloud spend analysis process?
- Provider-native tools vs. FinOps platforms: what should you prioritize?
- How do you turn spend analysis findings into savings?
- How do governance, budgets, and showback keep savings from disappearing?
- What’s different about analyzing Kubernetes and AI workload costs?
- How does a prioritized audit actually reduce cloud bills?
- Building cloud spend analysis into how your team actually operates
- Get a pay-on-savings cloud cost and security review
- Where to go for deeper technical reference
- Sources
What is cloud spend analysis?
Cloud spend analysis is not the same thing as cloud cost reporting. Reporting tells you what you spent last month. Analysis tells you why, and what to do about it next.
A report shows a $40,000 jump in EC2 spend. Analysis traces that jump to three oversized instances launched during a load test that nobody terminated, names the team that owns them, and estimates the monthly savings from right-sizing or shutting them down. That distinction is the whole reason FinOps teams exist separately from finance reporting teams.
Cloud spend analysis works as the diagnostic layer inside a broader FinOps lifecycle, sitting between raw billing data and the decisions finance and engineering actually make. The core outcomes it should deliver:
- Root-cause explanations for spend changes, not just the fact that spend changed.
- Forecast accuracy that finance can build a budget around, instead of guessing at next quarter’s cloud line item.
- Commitment optimization, meaning reserved instances and savings plans that match real usage rather than a one-time estimate from 18 months ago.
- Prioritized savings, ranked by dollar impact and effort, so engineering knows what to fix first.
Public cloud spending keeps climbing at double-digit rates year over year, according to Gartner’s forecast on worldwide public cloud spending. That growth curve is exactly why static, once-a-quarter cost reviews stop working. Spend that grows faster than your analysis cadence will always outrun your budget.
What metrics and KPIs actually measure spend analysis quality?
Four KPIs form the backbone of any credible cloud financial analysis practice. Skip any one of them and you’re flying with a blind spot.
- Allocation coverage %. The share of total spend mapped to a specific team, application, or environment through tags or account structure. Below 80%, showback and chargeback reports start losing credibility fast.
- Forecast variance %. The gap between what you predicted and what you actually spent, expressed as a percentage. Consistent variance above 10% signals your forecasting model needs new inputs, not just a bigger buffer.
- Commitment utilization %. How much of your reserved instance or savings plan capacity is actually being consumed. Idle commitment is money paid for nothing.
- Amortized effective rate. Your true blended cost per unit of compute once discounts, commitments, and credits are spread across the billing period. This is the number that tells you if you’re actually cheaper than on-demand pricing, not just theoretically cheaper.
Unit economics extend the picture past raw dollars. Cost per request, cost per active user, or cost per transaction turns a spend number into something a product manager can actually use in a pricing conversation. Environment ratios (production spend versus staging versus development) catch the common failure where a test environment quietly grows to cost nearly as much as production.
Pro Tip: Measure commitment utilization and effective amortized rate over a rolling 90-day window rather than the last billing cycle. A single traffic spike or seasonal promotion can make a commitment look underused or oversized when it’s actually performing fine over a longer horizon.
Each KPI maps to a different decision. Allocation coverage tells you whether showback numbers are trustworthy enough to present to a business unit leader. Forecast variance tells finance whether next quarter’s budget request needs a bigger contingency. Commitment utilization and effective rate tell your platform team whether it’s time to buy more savings plans or release capacity you’re not using. Cloud spend analysis, at its foundation, depends on normalized billing data and consistent tagging to make any of these KPIs mean anything across accounts and providers.
Where does the data for cloud bill analysis come from?
Every cloud spend analysis starts with the same raw material: billing exports. The quality of that raw data determines whether your analysis is trustworthy or just an educated guess dressed up in a spreadsheet.
- Pull the provider billing export. On AWS, that means the Cost and Usage Report or the data behind AWS Cost Explorer, which offers preconfigured views, hourly and resource-level granularity, forecasting up to 12 months out, and a conversational “Analyze with Amazon Q” feature for teams that want plain-language answers to spend questions. On Google Cloud, billing data exports directly to BigQuery, and Google’s cost management tooling layers reports, dashboards, budgets, alerts, and automated budget actions on top.
- Confirm required fields are present. You need resource IDs, SKU-level detail, applied discounts, and tags on every line. Missing any of these turns “normalization” into guesswork.
- Map accounts and projects to a consistent scope hierarchy. Account or project rolls up to a business scope (team, product, or cost center), which rolls up to a service category, which finally maps to an owner who can answer for the spend.
- Reconcile discounts and credits separately from list price. Blending them too early hides your true effective rate and throws off amortized cost calculations.
- Schedule a recurring pull, not a one-time export. Billing data updates on a delay, and stale exports produce stale conclusions.
Two pitfalls trip up nearly every team building this pipeline for the first time. First, AWS Cost Explorer takes time to backfill: after enabling it, the service prepares approximately one year of historical data, current-month figures appear within about a day, and the rest can take several more days to fully populate. Budget for that lag before you promise stakeholders a same-day answer. Second, resource-level detail sometimes goes missing on shared or managed services, which is exactly where hidden waste tends to hide. When that happens, cross-reference the resource ID against your infrastructure-as-code state or your Kubernetes cluster inventory to fill the gap manually.
How do you run a repeatable cloud spend analysis process?
A one-time audit finds waste once. A recurring process keeps waste from creeping back in. The cadence matters as much as the technique, and mixing daily, weekly, and monthly reviews catches problems at the speed they actually happen.
- Run daily delta monitoring. Compare yesterday’s spend against a rolling baseline and flag anything that moves more than a set threshold, whether that’s a percentage jump or an absolute dollar amount.
- Triage anomalies same-day. Not every spike is a problem. A marketing launch or a legitimate scaling event looks identical to a misconfigured autoscaling group until someone checks.
- Review weekly trends. Zoom out from single-day noise to spot slow creep, like a storage bucket that grows 2% every week and never gets cleaned up.
- Conduct monthly root-cause analysis. Pick the top cost movers from the month and trace each one back to a specific decision, deployment, or team.
- Scope the investigation. Start broad (which service category moved), then narrow (which account, which resource, which owner).
- Isolate the resource. Identify the exact instance, bucket, cluster, or function driving the change.
- Trace to an owner. Every finding needs a name attached, or it never gets fixed.
- Estimate the financial impact. State a monthly and annual savings figure, even a rough one, so the finding can be prioritized against other work.
- Recommend a specific fix and hand it off. A vague “investigate this” ticket dies in a backlog. A ticket that says “downsize this instance from m5.4xlarge to m5.xlarge, saving an estimated $310/month, low risk, reversible” gets done.
Multi-cadence analysis, mixing daily anomaly checks with weekly trend reviews and monthly deep dives, catches issues at very different speeds, and operational FinOps playbooks consistently point to that mix as the difference between catching a leak in days versus discovering it three months and several thousand dollars later.
Documentation is what separates a real remediation handoff from a hallway conversation. Every finding that goes to engineering should include the estimated savings, the exact change needed, the risk level, and a rollback plan in case the change breaks something. Skipping the rollback note is how teams talk themselves out of making changes at all, because nobody wants to be the one who broke production to save $200 a month.
Provider-native tools vs. FinOps platforms: what should you prioritize?
Cloud cost management tools fall into six functional categories, and no single tool excels at all six. Knowing which ones you actually need saves you from buying (or building) capability you’ll never use.
- Ingestion and normalization — pulling billing data from one or more providers into a consistent schema.
- Allocation — mapping spend to owners through tags, accounts, or business logic.
- Forecasting — projecting future spend based on historical trends and known commitments.
- Anomaly detection — flagging unusual spend automatically instead of waiting for a human to notice.
- Rightsizing automation — recommending or executing instance size changes based on actual utilization.
- Governance — enforcing budgets, alerts, and policy across accounts.
Provider-native tools like AWS Cost Explorer and Google Cloud’s billing reports are strong on raw detail. They give you hourly, resource-level granularity straight from the source, with no translation layer to introduce lag or error. For a single-cloud shop with a modest number of accounts, that native depth is often enough to run a full spend analysis practice without buying anything else.
Third-party FinOps platforms earn their cost when you’re running multiple clouds, need a unified allocation model across providers with wildly different billing formats, or want workflow features like automated ticketing and savings tracking baked in. Google Cloud’s own cost management documentation makes a similar distinction: native tools give you deep account-level detail, but multi-cloud normalization and FinOps workflow automation are where a dedicated platform adds real operational value. The decision point is usually spend scale and cloud count, not company size. A single-cloud startup spending $2 million a year on AWS may never need a platform. A five-cloud enterprise spending $500,000 a year might need one immediately, because the manual reconciliation cost alone justifies the tooling spend.
How do you turn spend analysis findings into savings?
A finding without a dollar estimate is an observation, not an action item. Cloud spend analysis earns its keep only when every discovery converts into something finance can approve and engineering can execute.
The standard format practitioners use is the savings card, and it needs six fields to be useful:
- Description — what the finding is, in one sentence.
- Root cause — why it’s happening (idle resource, oversized instance, orphaned snapshot, missing commitment).
- Estimated monthly and annual savings — a specific dollar figure, not a range so wide it’s meaningless.
- Difficulty — how much engineering effort the fix requires.
- Risk — what could break, and how reversible the change is.
- Owner — who is responsible for implementing it.
Practitioner guidance on cloud bill analysis consistently finds that waste signals like idle instances, orphaned snapshots, and oversized resources sit buried in resource-level billing lines until someone builds exactly this kind of structured card around them.
Prioritization comes down to weighing impact against effort and risk. A useful scoring approach: divide estimated monthly savings by hours to implement, then multiply by (1 minus a risk score between 0 and 1). Quick wins, like terminating an idle load balancer, score high because they cost almost nothing to fix and carry near-zero risk. Architecture changes, like re-platforming a database, might carry bigger savings but score lower because of the effort and risk involved.
Pro Tip: Track every implemented savings card against the following month’s actual bill. If the realized savings don’t match the estimate, your model is off somewhere, and that gap is worth investigating before you trust the next batch of estimates.
How do governance, budgets, and showback keep savings from disappearing?
Savings found once and never protected have a habit of quietly reappearing six months later. Governance is the mechanism that makes optimization stick instead of becoming an annual fire drill.
- Automated budget alerts catch overspend before it becomes a surprise on the monthly invoice, and enforcement policies (like automatically stopping non-production resources outside business hours) prevent the same waste from regrowing.
- Showback reports spend back to teams for visibility without billing them directly, useful for building cost awareness in engineering culture without the political friction of an internal invoice.
- Chargeback actually bills the cost back to a team’s budget, which works best once allocation coverage is high enough that the numbers won’t be disputed in every budget meeting.
- Retained savings tracking confirms that a fix implemented in March is still saving money in September, not just for the one month someone was watching closely.
- Forecast accuracy reporting closes the loop with finance, showing whether the analysis process is actually improving budget predictability quarter over quarter.
Teams building custom dashboards or automated policy enforcement on top of billing data sometimes need integration work that goes beyond what off-the-shelf tools offer. For that kind of custom build, a partner like LogicBranch can connect cost data to internal systems and enforcement workflows that a generic FinOps tool doesn’t cover out of the box.
What’s different about analyzing Kubernetes and AI workload costs?
Kubernetes and AI/ML workloads break the simple resource-to-bill mapping that works for traditional virtual machines, and treating them the same way as a standard EC2 fleet is one of the most common analysis mistakes.
- Namespace and cluster attribution requires mapping pods and deployments back to specific billing lines, since a single node often runs workloads for multiple teams simultaneously.
- Requests vs. actual usage matters because Kubernetes bills you for the node capacity reserved, not necessarily what a pod actually consumes, and the gap between the two is where a huge share of container waste hides. FinOps guidance on Kubernetes cost analysis points to exactly this requests-versus-usage mismatch as the starting point for any meaningful container cost review.
- GPU and AI token cost attribution needs project or team-level tagging at the job or pipeline level, since GPU instances are expensive enough that a single unattributed training run can distort an entire team’s monthly cloud budget report.
- Ephemeral workload scheduling benefits from rightsizing patterns tied to actual burst patterns rather than static instance sizing, since AI training jobs and batch pipelines rarely run at a constant load.
Get the attribution right at the namespace or job level, and rightsizing decisions become straightforward. Get it wrong, and every GPU cost conversation turns into a finger-pointing exercise between teams.
How does a prioritized audit actually reduce cloud bills?
An outcome-driven audit doesn’t stop at a report. It produces a ranked list of savings cards, each with an estimated dollar impact, a difficulty rating, and a named owner, so engineering knows exactly what to fix first and finance knows exactly what to expect.
Cost Beacon runs this process by pairing AI-driven billing analysis with hands-on engineering review, catching both the obvious waste (idle resources, oversized instances) and the subtler issues that automated scans miss. Because the engagement is pay-on-savings, with no upfront fee, the incentive to find real, implementable savings rather than padding a report is built directly into the pricing model.
Building cloud spend analysis into how your team actually operates
Most organizations treat cost analysis as a quarterly fire drill instead of an operating habit, and that’s the single biggest reason savings don’t stick. The blocker is rarely tooling. It’s ownership: nobody on the engineering side is accountable for cost the way they’re accountable for uptime.
Automation and AI genuinely help with anomaly detection and pattern-matching across thousands of billing lines, work no human should do by hand. But judgment calls, deciding whether a spike is a real problem or a legitimate business event, still need a person who understands the context. Don’t outsource that call entirely to a dashboard.
Start small. Pilot the daily-to-monthly cadence on one account, lock in allocation coverage and forecast variance as your first two KPIs, and build governance around whatever you find before you scale the process wider.
— Aaditya Parashar
Get a pay-on-savings cloud cost and security review
The direct route to the outcome this entire article describes is a prioritized savings plan you can hand to engineering next week, not a dashboard you have to learn to interpret yourself. The process combines AI-driven billing analysis with hands-on engineering validation to catch idle resources, oversized instances, and misconfigured commitments across AWS, Google Cloud, Azure, and Kubernetes environments.
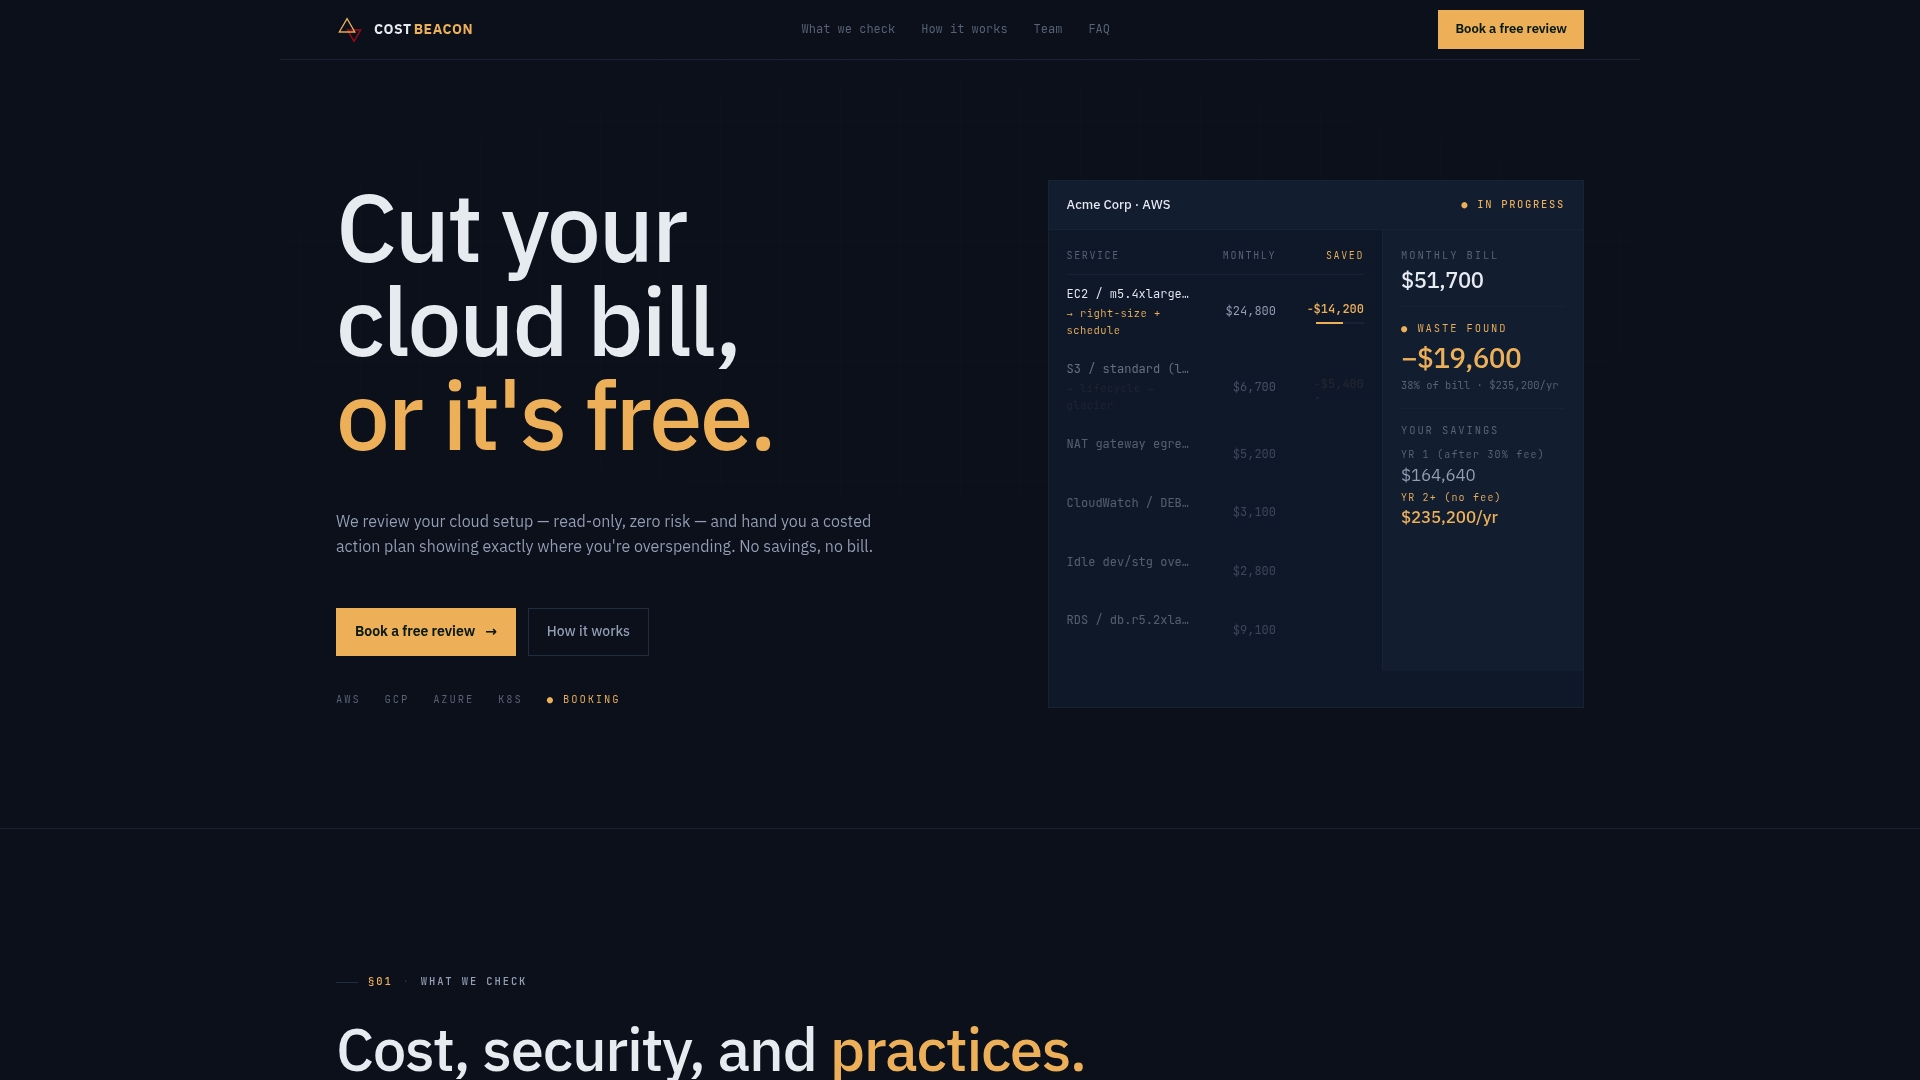
Every engagement produces a prioritized action plan listing expected savings per item, so finance sees the dollar impact before engineering commits to a fix. Optional implementation support may be available to execute the changes directly rather than just hand off the recommendations. The pricing model can be risk-free, invoicing a fee based on savings actually realized, so there may be no upfront cost and no reason not to find out what a full audit would uncover.
Check your eligibility and see what a pay-on-savings cloud cost review could find in your own AWS bill.
Where to go for deeper technical reference
For hands-on implementation detail, go straight to AWS Cost Explorer’s documentation for granular filtering and forecasting setup, and Google Cloud’s cost management docs for budget automation and BigQuery export configuration. The Infracost glossary on cloud spend analysis is a solid primer on KPI definitions and tagging fundamentals if you’re building your metrics framework from scratch.
Sources
Aaditya works on cloud cost and platform engineering at Cost Beacon, mostly on AWS and Kubernetes estates that grew faster than anyone planned for.
 Cost Beacon