Cloud cost visibility means knowing exactly which team, service, or feature drove every dollar of your cloud bill, at a granularity fine enough to act on. The outcome that matters isn’t a dashboard. It’s accurate, auditable attribution across accounts, teams, and services, the kind that survives an audit and holds up when finance asks engineering to explain a spike.
Two data points anchor this: AWS Cost Categories let you group and retroactively re-tag up to 12 months of billing history, so a missed tag in January doesn’t permanently corrupt your Q1 report. And when Cost Beacon audits cloud accounts for FinOps and engineering teams, the average bill reduction is significant, almost always because visibility gaps hid waste for months before anyone noticed.
Real visibility gives you three things:
- A single source of truth that finance and engineering both trust
- Attribution granular enough to assign cost to a team, not just a service
- An audit trail that shows why a number changed, not just that it did
Key Takeaways
Cloud cost visibility depends on normalized data, retroactive attribution tools like AWS Cost Categories, and governance that turns a report into recurring accountability.
| Point | Details |
|---|---|
| Visibility means attribution | A cost report only counts as visibility when every dollar maps to an accountable owner. |
| Fix plumbing before dashboards | Reliable billing exports and a canonical schema matter more than any visualization layer. |
| AWS Cost Categories solve tagging lag | They regroup up to 12 months of historical spend without requiring perfect tags from day one. |
| Governance sustains visibility | Ownership, budget alerts, and CI/CD cost checks keep visibility from decaying after setup. |
| Cost Beacon accelerates results | Its hybrid AI and engineering audit achieves a significant bill reduction on a pay-on-savings basis. |
Table of Contents
- What is cloud cost visibility, really?
- Why does visibility break down at scale?
- How do AWS Cost Categories fix attribution?
- What are the practical steps to build reliable visibility?
- Which visibility tools fit your team’s stage?
- How should FinOps govern spend once visibility exists?
- How do you measure whether visibility is actually working?
- Why does a hybrid audit model close visibility gaps faster?
- A FinOps playbook built for teams that scale first
- Get a prioritized savings plan without the build time
- Frequently asked questions
- Sources
What is cloud cost visibility, really?
Most teams think they have cost visibility because they can log into a billing console and see a total. That’s cost reporting, not visibility. Visibility requires three distinct layers working together: raw data ingestion, normalization, and attribution.
Data sources form the foundation. You need billing exports (AWS Cost and Usage Report, Azure Cost Management exports, GCP billing exports to BigQuery), resource tags, a current resource catalog, and ideally telemetry from your observability stack. Miss any one of these and you get gaps that show up as unexplained “untagged” or “other” line items.
Normalization comes next. AWS, Azure, and GCP each structure billing data differently, with different units, different service names, and different hierarchy models. Building a canonical schema that translates all three into one format is what makes multi-cloud reporting possible, rather than three separate reports nobody reconciles.
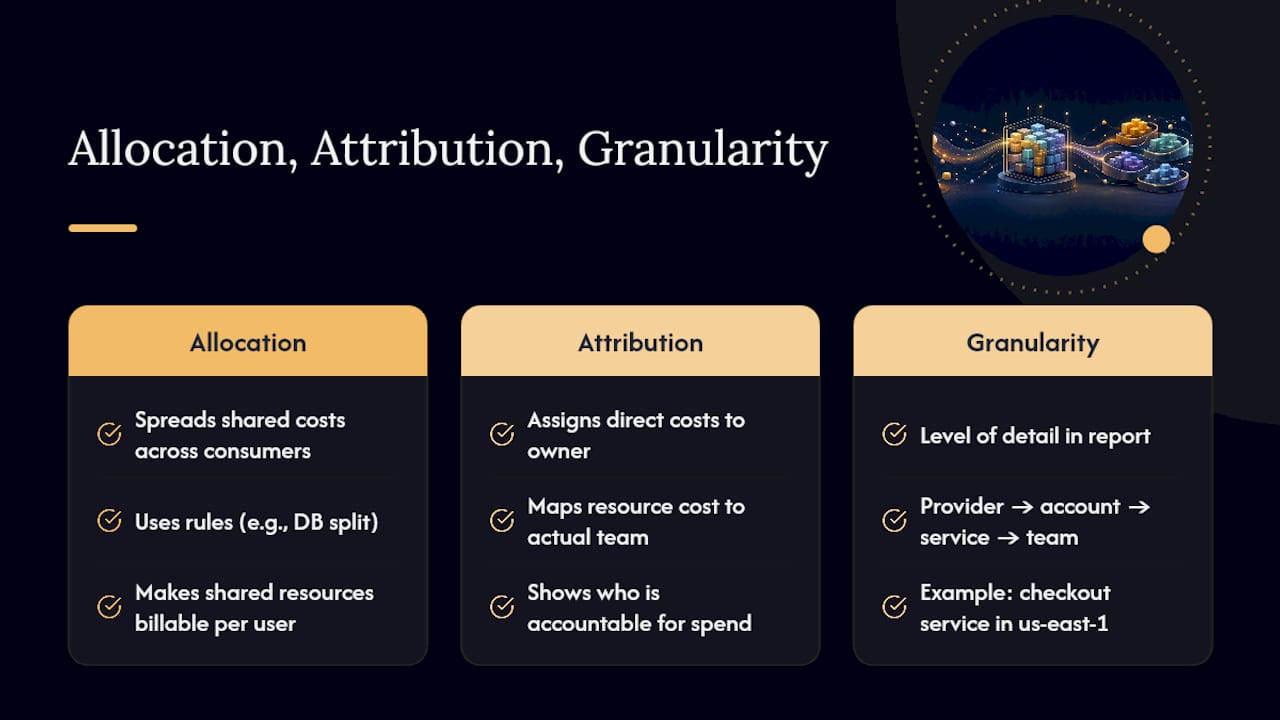
Allocation, attribution, and granularity are related but not the same concept. Allocation spreads shared costs (like a shared database) across consumers using a rule. Attribution assigns direct costs to their actual owner. Granularity determines whether you’re looking at “AWS” or “the checkout service in the payments team’s us-east-1 account.” You need all three, because a report that’s granular but not attributed just tells you where money went, not who’s accountable for it.
Pro Tip: Link cost data to your observability platform before you build a single dashboard. A cost spike without a corresponding telemetry signal is nearly impossible to root-cause, and teams that skip this step end up guessing.
Why does visibility break down at scale?
Visibility that works cleanly for one AWS account with ten resources falls apart at 200 accounts and five cloud providers. The failure modes are predictable, and they compound in this order:
- Tag drift. Naming conventions get enforced at launch, then decay as new engineers join and old rules get forgotten. Six months in, “team=payments” and “Team:Payments” coexist in the same account.
- Account and project sprawl. Organizations spin up new AWS accounts or GCP projects faster than anyone updates the hierarchy that’s supposed to map them to business units.
- Billing export gaps. Exports that run daily instead of hourly, or that silently stop when a permission expires, create blind windows that nobody catches until the monthly reconciliation.
- Uncategorized charges. Marketplace fees, support charges, and shared infrastructure costs often don’t map cleanly to any tag, and they pile up in an “uncategorized” bucket that grows every month.
- Ownership ambiguity. When no single team is accountable for a cost category, nobody investigates anomalies until finance escalates.
Each of these is a process failure, not a tooling failure. That distinction changes where you spend your first month of remediation effort.
How do AWS Cost Categories fix attribution?
AWS Cost Categories solve a problem native tagging can’t: they let you group costs retroactively, using rules rather than requiring every resource to be tagged correctly from day one. That retroactive window, up to 12 months, means you can build a category today and apply it to historical spend, which is invaluable when finance needs a clean quarterly report and your tagging discipline only started three months ago.
Cost Categories use rule operators, ANY and ALL, to combine conditions like account ID, service, charge type, and existing tags. A common pattern:
- Map each AWS account to a business unit using account ID rules
- Layer in service-level rules to split a shared account by workload
- Use ANY operators for broad catches (any EC2 or RDS charge in an account) and ALL operators for precise splits (an account AND a specific tag value)
- Create a catch-all “unallocated” category so nothing silently disappears from the report
Split charges, like a shared NAT gateway or a support plan, need an allocation method layered on top of categories, usually proportional to usage or a fixed percentage agreed with finance.
Cost Categories integrate directly with Cost Explorer for visualization, AWS Budgets for threshold alerts scoped to a category, and Data Exports for feeding categorized data into your own warehouse. That last integration matters most for teams running multi-cloud, since it’s how AWS data joins Azure and GCP data in one normalized table.
What are the practical steps to build reliable visibility?
Skip the dashboard shopping and start with plumbing. The order matters, because each step depends on the one before it.
- Verify billing exports. Confirm AWS CUR lands in S3 on schedule, GCP billing exports write to BigQuery, and Azure Cost Management exports run without gaps. Provider billing data typically updates multiple times a day, and many pipelines can pull hourly once exports are configured correctly.
- Build a canonical schema. Map each provider’s fields, service, account, region, charge type, into one shared structure before you write a single report against it. Normalized schemas are what make cross-cloud comparisons trustworthy rather than approximate.
- Enforce tags automatically. Deploy validation that flags or blocks resources missing required tags at creation, rather than catching drift in a monthly cleanup. Tag enforcement pipelines close attribution gaps before they accumulate.
- Add anomaly detection and reconciliation. Schedule automated comparisons between forecasted and actual spend, and run a manual reconciliation pass monthly until the automated checks earn your trust.
Pro Tip: Build the tag-validation pipeline before the anomaly detection. An anomaly alert is only useful if you can immediately attribute the spike to a team, and that requires clean tags already in place.
Which visibility tools fit your team’s stage?
Not every team needs the same tooling, and the right choice depends on scale and how fast your infrastructure changes.
- Native cloud consoles (Cost Explorer, GCP’s Cost Management, Azure Cost Management) deliver fast wins for single-cloud teams but struggle once you’re normalizing across providers or need custom attribution logic.
- FinOps platforms add normalized multi-cloud reporting and allocation engines out of the box, which saves engineering time but usually costs more per month than native tools and needs configuration to match your org’s hierarchy.
- Observability-integrated solutions connect cost data directly to telemetry, letting you drill from a spend spike to the service and deployment that caused it, which is the fastest path to root cause but requires you already have solid observability in place.
- Data warehouse and BI approaches (billing data in BigQuery or Redshift, visualized in a BI tool) offer the most flexibility and the lowest software cost, at the price of real engineering time to build and maintain.
Team size and deployment velocity should drive the decision more than feature checklists. A five-person platform team rarely needs the same stack as a 200-engineer organization running weekly releases across four cloud providers.
How should FinOps govern spend once visibility exists?
Visibility without governance decays within a quarter. Turning a clean cost view into lasting control takes four organizational habits, not more tooling.
- Assign a cost-accountable owner to every category, account, or business unit. No owner means no one investigates when a number moves.
- Automate budget alerts and restrict spending permissions with role-based access control, so a threshold breach triggers a notification instead of a surprise invoice. Cloud providers already support this pattern, including Google Cloud’s programmatic budget actions that trigger automatically when thresholds are exceeded.
- Add cost checks to CI/CD. A pull request that provisions a new RDS instance or GPU fleet should surface its projected cost before merge, not after the first invoice.
- Run recurring optimization sprints tied to OKRs, so cost reduction is a scheduled team activity rather than a fire drill when finance complains.
Pro Tip: Tie one optimization sprint per quarter directly to a dollar target in your team’s OKRs. Visibility work that isn’t tied to a number tends to lose priority the moment a product deadline looms.
How do you measure whether visibility is actually working?
Four KPIs tell you whether your cost visibility program is real or theoretical.
- Attribution coverage: the percentage of total spend mapped to a specific owner. Below 80% usually means your tagging or Cost Category rules have real gaps.
- Time-to-detect: how long between an anomaly occurring and a human noticing it. Mature teams measure this in hours, not billing cycles.
- Reconciliation delta: the difference between your internal reports and the provider’s invoice. A shrinking delta over successive months is the clearest sign your pipeline is maturing.
- Realized savings: dollars actually removed from the bill after a recommendation is implemented, not just identified. This is the number finance actually cares about, and it’s the one Cost Beacon’s pay-on-savings model is built around, since fees only apply once savings land.
Why does a hybrid audit model close visibility gaps faster?
Building full visibility internally can take a FinOps team months, and most of that time goes to normalization plumbing rather than finding savings. A hybrid approach that pairs algorithmic discovery with engineer validation finds optimization opportunities more reliably and gets fixes implemented faster than either automation or manual review alone.
Cost Beacon’s engagement follows a clear sequence:
- Ingest billing and usage data across AWS, GCP, Azure, or Kubernetes
- Surface prioritized findings, ranked by expected dollar impact
- Deliver an action plan an engineering team can implement directly, with implementation support available
The proof point that matters to finance: a noticeably reduced bill, delivered under a pay-on-savings model where fees apply only after savings are realized. For teams choosing between building visibility internally or bringing in a managed audit, the practical answer often depends on urgency. If you need results this quarter and don’t have spare engineering capacity, a managed audit closes the gap faster than a build-from-scratch pipeline.
| Point | Details |
|---|---|
| Definition | Cloud cost visibility means attribution accurate enough to assign every dollar to an owner. |
| Fastest AWS win | AWS Cost Categories retroactively group up to 12 months of spend without re-tagging everything first. |
| Biggest failure mode | Tag drift and account sprawl cause most attribution gaps, not missing tools. |
| Key KPI | Attribution coverage above 80% signals a mature visibility program. |
| Managed option | Cost Beacon’s hybrid AI-plus-engineering audit achieves a significant bill reduction on a pay-on-savings basis. |
A FinOps playbook built for teams that scale first
The conventional advice on cloud cost visibility treats it as a tooling problem: buy a platform, connect your accounts, done. That’s backward. Every failure mode covered here, tag drift, account sprawl, uncategorized charges, is a process failure that a dashboard can display but never fix on its own.
What’s underrated is how much leverage sits in AWS Cost Categories specifically. Most teams treat tagging as the only path to attribution, then get stuck rewriting tags for months. Retroactive categorization removes that bottleneck entirely, and teams that lean on it get clean multi-cloud reports far faster than teams chasing perfect tags from day one.

Where I’d push back hardest: don’t wait for perfect internal tooling before you start measuring realized savings. Attribution coverage and time-to-detect matter, but the number finance actually remembers is the dollar figure that hit the bottom line. Prioritize the KPI that proves the work mattered, then build the plumbing to sustain it. For teams without spare engineering bandwidth, a managed audit is a legitimate way to get that first proof point on the board while you build the rest.
Get a prioritized savings plan without the build time
Cost Beacon is the direct path to cloud cost visibility for teams that don’t have months to spend on normalization pipelines and tag enforcement projects. Instead of buying another dashboard and hoping your engineers find time to configure it, you get an AI-driven audit backed by engineers who validate every finding before it reaches your action plan.
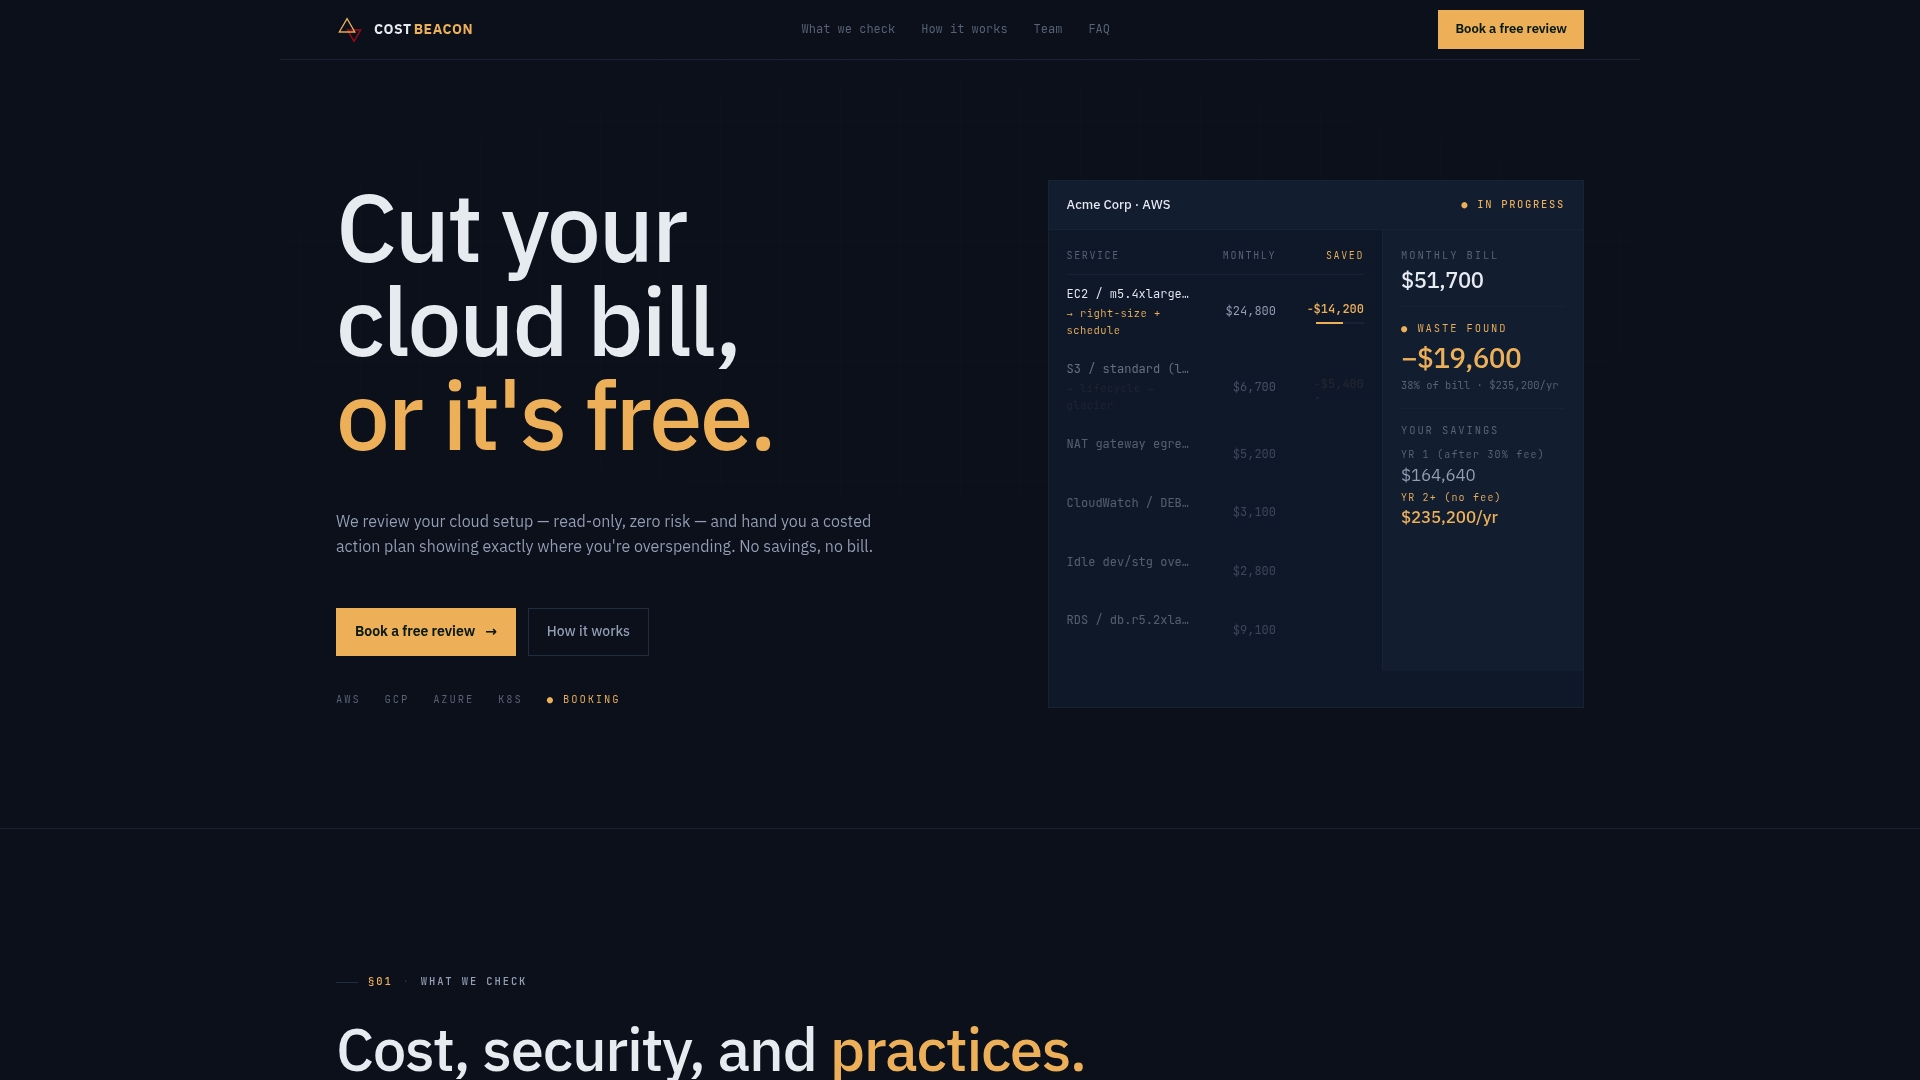
The engagement fits FinOps and engineering leaders who need results this quarter, not a six-month internal build. Cost Beacon’s audits deliver notable bill reductions across AWS, GCP, Azure, and Kubernetes environments, and the pay-on-savings model means you’re never billed for work that didn’t produce a real dollar reduction. If your last cost review turned into a spreadsheet nobody actioned, start a review with Cost Beacon and get a prioritized plan with dollar estimates attached to every line item.
Frequently asked questions
What is the difference between cloud cost visibility and cloud cost monitoring? Cloud cost monitoring tracks spend over time and flags when it changes. Cloud cost visibility goes further, attributing that spend to a specific owner, service, or business unit so someone can actually act on the change.
How long does it take to achieve reliable multi-cloud cost visibility? Building normalized, tag-validated visibility internally often takes a FinOps team two to four months, depending on how many accounts and providers you’re consolidating. A managed audit can surface prioritized findings in weeks because the normalization work is already built.
Do AWS Cost Categories replace tagging? No. Cost Categories work alongside tags and other dimensions like account ID and service, and they add the ability to retroactively regroup historical spend, which tagging alone can’t do.
What is a healthy attribution coverage percentage? Mature FinOps programs typically aim for high attribution coverage, minimizing unallocated spend, meaning less than 10% of spend sits in an unallocated or uncategorized bucket at any given time.
Is a managed cloud cost audit worth it for a smaller engineering team? If your team lacks the bandwidth to build export pipelines, tag enforcement, and reconciliation processes internally, a managed audit like Cost Beacon’s often delivers savings faster, and the pay-on-savings model means there’s no upfront cost if it doesn’t find real reductions.
Sources
- Improve cost visibility and observability with AWS Cost Categories – part 1: fundamentals and basic grouping techniques
- Cloud cost management | Google Cloud
Recommended
Aaditya works on cloud cost and platform engineering at Cost Beacon, mostly on AWS and Kubernetes estates that grew faster than anyone planned for.
 Cost Beacon