Cloud cost anomaly detection is the practice of using statistical or machine learning models to flag spending that deviates from your normal usage pattern, often before a monthly bill ever lands. The immediate action: turn on your provider’s native detection (AWS Cost Anomaly Detection, GCP’s Cost Anomaly Detection, or OCI’s equivalent) and route every alert to a named owner, not a shared inbox. AWS gets the deepest treatment here because it’s where most engineering teams carry the largest, most volatile spend.
TL;DR:
- Native cloud anomaly detection tools are most effective at catching sudden spikes but require proper configuration, owner assignment, and routing to be useful.
- Detection latency varies by platform, with AWS typically providing alerts within hours and OCI requiring up to 60 days of history for full accuracy, making timely response critical.
- Combining absolute dollar and percentage thresholds and segmenting monitors by workload volatility significantly reduces false positives and improves detection relevance.
- Alert routing into dedicated communication channels and immediate notification of high-impact anomalies enable faster remediation and better cross-team communication.
- Anomaly detection alone misses steady, baseline waste, so an outside audit like Cost Beacon’s can identify hidden overprovisioned or idle resources for deeper cost savings.
Table of Contents
- Why anomaly detection matters for FinOps and engineering
- How does cloud cost anomaly detection actually work?
- Platform notes and configuration, with an AWS focus
- What’s the triage and remediation workflow for a cost anomaly?
- How should alerts route to minimize noise and delay?
- How do you tune monitors and keep false positives low?
- Which metrics prove anomaly detection is working?
- A 30 to 90 day rollout plan for cloud cost anomaly detection
- When does this call for a specialist audit instead of a self-serve setup?
- What the data actually says about cost anomaly detection
- Get a pay-on-savings audit from Cost Beacon
- Sources
Why anomaly detection matters for FinOps and engineering
Budgets tell you when you’re about to blow past a number you already picked. Anomaly detection tells you something changed that you didn’t pick at all. Those are different jobs, and conflating them is the most common mistake teams make when they set up cost governance.
A budget alert fires when spend crosses a static threshold, usually monthly. It’s useful for pacing, but it says nothing about why spend moved or whether the move is normal. A misconfigured autoscaling group can double your compute bill on a Tuesday and your monthly budget alert won’t notice until the third week of the month, by which point you’ve paid for three weeks of a mistake. Anomaly detection compares today’s spend against a statistical baseline built from your own usage history, so it catches the spike within hours instead of weeks.
The shift matters more now than it did five years ago. Services provision faster, autoscaling reacts to load in seconds, and AI workloads can spin up expensive GPU instances with a single API call. A FinOps Foundation working group frames this exact problem: anomaly detection exists to catch deviations from expected spend before they compound, which is a fundamentally different posture than the retrospective reporting most finance teams grew up on.
What changes operationally once you have real anomaly detection running:
- Remediation gets faster because engineers get a targeted alert, not a monthly reconciliation surprise
- Surprise spend at the end of the billing cycle drops because issues get caught mid-month
- Investigations get prioritized by dollar impact instead of getting buried in a spreadsheet of line items
- Finance and engineering start speaking the same language, because both sides see the same anomaly event at the same time
None of this replaces budgeting or forecasting. It sits alongside them, catching the events those tools are structurally blind to.
How does cloud cost anomaly detection actually work?
Every major provider’s detection engine runs on the same basic idea: build a statistical baseline of what “normal” looks like for a given cost dimension, then flag anything that falls outside a calculated prediction interval. The differences show up in the details, and those details determine how fast you find out about a problem.
Baseline models draw on historical spend, usually segmented by service, account, or usage type. Good models account for seasonality: a batch job that runs every Sunday night isn’t an anomaly just because it doesn’t run Monday through Saturday. This is standard statistical process control territory, the same family of techniques used in manufacturing quality control, applied to a billing dataset instead of a production line. The model calculates an expected range for spend on a given day, and anything outside that range gets scored as a potential anomaly.
Two technical constraints matter more than any dashboard feature:
- Data latency. Billing data itself lags behind actual usage, sometimes by hours.
- Detection cadence. Providers don’t recalculate continuously; they run on a schedule.
AWS Cost Anomaly Detection (CAD) illustrates both constraints clearly. It pulls from Cost Explorer data and runs about three times a day, with billing data itself carrying up to a 24-hour latency. Stack those together and your realistic time-to-detect for a new anomaly can run close to a full day, not minutes. That’s a meaningful planning input: if your team assumes near-real-time detection and it isn’t there, you’ll misjudge how fast you can actually respond to a spike.
Pro Tip: Build your incident response SLA around the actual detection delay for each platform, not the marketing copy. A 24-hour latency assumption on AWS keeps your team from panicking when an alert lands “late.”
Cold starts are the other constraint engineers underestimate. A brand-new service has no history, so there’s nothing to compare against. AWS requires roughly 10 days of historical data before it can evaluate a new service subscription for anomalies. Oracle Cloud Infrastructure goes further: OCI’s anomaly algorithms model daily, weekly, and yearly seasonality, and some monitors need up to 60 days of history before they reach full functionality. If you’re migrating a new workload onto OCI, don’t expect meaningful anomaly coverage in week one.
Detection latency by platform
| Platform | Detection cadence | Data latency | Minimum history needed |
|---|---|---|---|
| AWS CAD | About 3 times/day | Up to 24 hours | ~10 days for new services |
| OCI | Continuous with seasonality modeling | Not separately stated | Up to 60 days for full functionality |
The practical takeaway: anomaly detection is a decision-support layer, not a fire alarm. It narrows your search space and points you at the right dollar figure and the right service, but the clock between an actual spike and your notification is longer than most teams assume.
Platform notes and configuration, with an AWS focus
AWS Cost Anomaly Detection deserves the most attention here because it’s where the largest share of enterprise cloud spend concentrates, and because its configuration choices materially change how fast you catch problems.
- Start with a managed monitor. AWS CAD ships default monitors that watch your overall account spend without any setup. This is where every team should begin, because it costs nothing to enable and covers the broad case immediately.
- Layer in custom monitors for volatile services. Custom monitors let you set different thresholds for specific cost dimensions, which matters enormously in environments where one team’s normal spend pattern would trip false alarms for another. A managed, account-wide monitor treats a data science team’s GPU burst the same way it treats a billing bug, and that’s the wrong lens for either one.
- Connect alerts to SNS, email, or chat. AWS CAD can route anomaly alerts through Amazon SNS, which fans out to email, Slack, or Microsoft Teams. Skipping this step and leaving alerts sitting in the Billing console is the single most common reason detection programs fail: nobody’s watching the console.
- Remember the 10-day rule for new services. If you just turned on a new AWS service, don’t expect anomaly coverage until it has roughly 10 days of billing history behind it.
Google Cloud takes a different technical approach. Its Cost Anomaly Detection monitors hourly rather than a few times a day, uses AI-generated thresholds instead of manually set ones, and comes with alerts enabled by default once GA’d. For fast-moving AI and GPU workloads, Google Cloud went a step further with early anomalies and spend caps that can halt usage automatically when a cap is reached, which is a meaningfully more aggressive enforcement posture compared to AWS’s alert-only model. Alert routing runs through Pub/Sub and email.
Azure and OCI both lean on longer history windows and seasonality-aware algorithms. OCI in particular can require up to 60 days of data for some monitors to reach full accuracy, so teams standing up a new OCI account should treat the first two months as a calibration period, not a coverage gap to panic over.
For most teams, the right sequence is: enable every provider’s default managed monitors immediately, wire alerts into a real communication channel in week one, then spend the next month adding custom monitors only where volatility genuinely warrants a different threshold.
What’s the triage and remediation workflow for a cost anomaly?
An anomaly alert without a runbook is just a notification that makes someone anxious. The workflow below turns that notification into a resolved incident.
- Confirm the dollar impact and scope first. Check whether the anomaly is a $50 blip or a $15,000 trajectory, and whether it’s isolated to one account, region, or usage type. This single step decides whether you escalate now or log it for the weekly review.
- Check for recent deploys or config changes. Most cost anomalies trace back to something a human or a pipeline just did: a new autoscaling policy, a forgotten test environment, a misconfigured storage lifecycle rule.
- Identify the top contributors. Break the anomaly down by service, account, region, and usage type, and focus on the top three to five contributors rather than trying to explain every dollar. This is where root-cause analysis actually happens, not in the alert itself.
- Cross-correlate with audit logs. Billing data alone rarely tells you which API call started the spike; cross-referencing the anomaly window against CloudTrail (or the equivalent audit log on other clouds) usually surfaces the specific principal or automation that triggered it.
- Route to the right owner, not a general channel. Map every monitor to a specific team or individual ahead of time. An alert that lands in a channel nobody owns dies there.
- Choose a remediation path. For a clear misconfiguration, fix it directly. For anything touching production, get a human sign-off before you throttle or terminate resources; automated remediation should stay gated for production workloads and reserved for lower-risk environments like dev and test.
- Close the loop with a short RCA. Document what happened, what it cost, and whether the monitor should be tuned. If it was a false positive, log it as one so it feeds back into future threshold tuning.
Pro Tip: Keep a running “anomaly log” separate from your incident tracker. Six months of logged root causes will tell you more about where your real cost leaks live than any single dashboard.
Because billing data itself can lag up to a day behind actual usage, the fastest teams build automated crosswalks that link an anomaly event directly to the audit log entries from that same time window, cutting investigation time from hours to minutes.
How should alerts route to minimize noise and delay?
The tradeoff at the center of alerting design is simple: immediate notifications catch problems fast but train people to ignore alerts if too many are false positives, while daily digest summaries reduce noise but slow down response on anything urgent.
Use immediate alerts, delivered through SNS or Pub/Sub straight into a dedicated chat channel, for anything crossing a high-dollar absolute threshold or hitting a production account. Use daily or weekly summary digests for lower-severity anomalies in dev/test environments, where a few hours of delay costs nothing.
Design the alert content itself with the responder in mind, not the system that generated it:
- Lead with the dollar impact, not the percentage change alone
- Link directly to the likely root-cause contributors, not just the account name
- Include a link to the relevant runbook so the person on call doesn’t have to hunt for it
- Name the owning team or individual in the alert body itself
Amazon explicitly recommends pushing anomaly alerts into team communication tools like Slack or Teams rather than leaving them in a console, because time-to-remediation drops sharply once the alert lands where the team already works. A partner platform like Centriops is worth a look if your team already centralizes operational alerts and incident routing across distributed teams, since cost anomalies fit naturally into that same routing logic.
On automation: gate any automated throttle or shutdown behind environment type. Dev and test resources are reasonable candidates for automatic termination past a threshold. Production resources should trigger a human approval step first, every time, no exceptions for how confident the model looks.
How do you tune monitors and keep false positives low?
Raw anomaly detection out of the box tends to either miss real problems or drown you in noise, and the fix is deliberate tuning, not a better algorithm.
Set both an absolute dollar threshold and a percentage threshold on every monitor, and require both to trigger before an alert fires. An absolute-only threshold will miss a genuine problem on a smaller account. Combining the two filters out the noise that erodes trust in the system fastest.
Segment monitors by sensitivity to match how volatile each workload actually is:
- High-sensitivity monitors for stable, predictable production services where any deviation is meaningful
- Medium-sensitivity monitors for workloads with known seasonal or bursty patterns
- Low-sensitivity or summary-only monitors for dev/test accounts where noise tolerance is high
Maintain an exceptions calendar for planned spend spikes, like a scheduled load test or a seasonal traffic event, so the model doesn’t relearn a one-off spike as a new normal or, worse, fire a false alarm your team has to manually dismiss every time. Provider ML models do account for seasonality and trend, but false positives remain common in genuinely dynamic environments, which is exactly why a human feedback loop still matters even with a good model underneath.
Pro Tip: Every time you mark an alert as a false positive, log the reason in one sentence. After a quarter, that log becomes the single best input for your next round of threshold tuning.
Governance should run on a fixed monthly cadence: review threshold performance, confirm every monitor still has a living owner, and audit whether the linked runbooks are still accurate. Anomaly detection that isn’t revisited monthly degrades quietly until nobody trusts the alerts anymore.
Which metrics prove anomaly detection is working?
Five numbers tell you whether your program is actually earning its keep, and none of them require exotic tooling to track:
- Anomalies detected per period — the raw volume, tracked over time to spot trend shifts
- False positive rate — the share of alerts that turned out to be nothing, tracked per monitor
- Time-to-detect — how long between the actual spend event and the alert firing
- Time-to-remediate — how long between alert and resolved root cause
- Cost impact avoided — the dollar estimate of what continued spend would have cost had it run undetected for another week
Build a dashboard that links each anomaly event to its root-cause contributors and its eventual remediation outcome, rather than treating detection and resolution as separate systems. That link is what turns a list of alerts into a record finance leadership can actually use.
Feed remediation outcomes back into forecasting and chargeback models on a regular cycle. If a team’s anomaly turned out to be a permanent usage increase rather than a one-off mistake, that needs to update their forecast baseline, not just get closed as a ticket. Skipping this step is how the same “anomaly” ends up getting flagged every month for a workload that simply grew.
A 30 to 90 day rollout plan for cloud cost anomaly detection
Getting from zero to a functioning program doesn’t require a quarter of planning meetings. It requires a sequence.
- Week 0 to 1: turn on native tools. Enable AWS Cost Anomaly Detection, GCP’s Cost Anomaly Detection, and OCI’s equivalent across every account you manage. Enable any required billing export features. Stand up a dedicated notification channel (a Slack channel or Teams channel built for this purpose, not a general-purpose one).
- Week 1 to 4: get default monitors alerting correctly. Confirm managed monitors are active on every account, set conservative alert thresholds to avoid an early flood of noise, and map every monitor to a named owner before the first real alert lands.
- Month 2 to 3: add custom monitors and safe automation. Layer custom monitors onto your highest-risk or most volatile workloads, the ones a generic account-wide monitor can’t tune correctly. Introduce automated remediation only for dev/test resources, gated behind clear rules.
- Ongoing: monthly reviews and incident drills. Run a monthly threshold review, audit runbook accuracy, and run at least one incident drill per quarter so the team isn’t learning the process for the first time during a real spike.
30/60/90 day milestones
| Timeframe | Milestone | Owner action |
|---|---|---|
| Days 1 to 7 | Native detection enabled, channel created | Platform team enables tools |
| Days 10 to 30 | Default monitors live, owners mapped | FinOps lead assigns owners |
| Days 31 to 60 | Custom monitors added, dev/test automation live | Engineering leads tune thresholds |
| Ongoing | Monthly review, quarterly drill | FinOps + engineering jointly |
By day 90, a team running this sequence has moved from zero visibility to a program with named owners, tuned thresholds, and at least one tested incident response, which is a realistic bar for most organizations without dedicating a full quarter to the effort.
When does this call for a specialist audit instead of a self-serve setup?
Provider-native tools cover the detection half of the problem well. What they don’t do is tell you whether your baseline itself is bloated, whether instances are oversized before an anomaly ever fires, or whether last year’s “normal” spend was already full of waste.
That’s the gap Cost Beacon works in. Cost Beacon combines AI-driven analytics with hands-on engineering review across AWS, GCP, Azure, and Kubernetes environments to find idle resources, oversized instances, and configuration issues that sit below any anomaly threshold because they’re not deviations, they’re just steady, expensive waste. Cost Beacon reports an average bill reduction of 32% across clients spanning fintech to telecom, delivered through a prioritized action plan with expected savings attached to each item. The engagement model involves payment based on savings realized, with no upfront fee or retainer required.
Self-serve monitoring is the right starting point for any team, and it should be running before you consider anything else. An outside audit makes sense once you suspect your baseline itself, not just your anomalies, has room to shrink.
What the data actually says about cost anomaly detection
The evidence here supports a fairly narrow, unglamorous judgment: detection tools are good at catching sudden deviations, and mediocre at catching slow, steady waste. AWS CAD, GCP’s engine, and OCI’s algorithms all excel at the spike. None of them will tell you that an oversized EC2 fleet has been quietly overpaying for eight months, because nothing about that pattern looks like a deviation. It looks like your new normal.

The conventional advice, enable the tool and trust the alerts, undersells how much tuning and ownership mapping determines whether a program actually works. A monitor with no owner and no threshold discipline generates noise, not signal, and noise gets ignored within a month.
Prioritize owner mapping and alert routing before you touch a single sensitivity setting. A perfectly tuned monitor that alerts into a channel nobody reads has accomplished nothing. Get the routing right first, then spend your tuning effort on the thresholds.
— Aaditya Parashar
Get a pay-on-savings audit from Cost Beacon
Native anomaly detection catches the spikes. It won’t catch the oversized instance that’s been quietly overbilling you since last spring, or the idle resource nobody remembered to shut down. This approach involves a combined AI-driven and engineer-led audit across various cloud environments to find waste sitting underneath your baseline, not just the deviations from it.
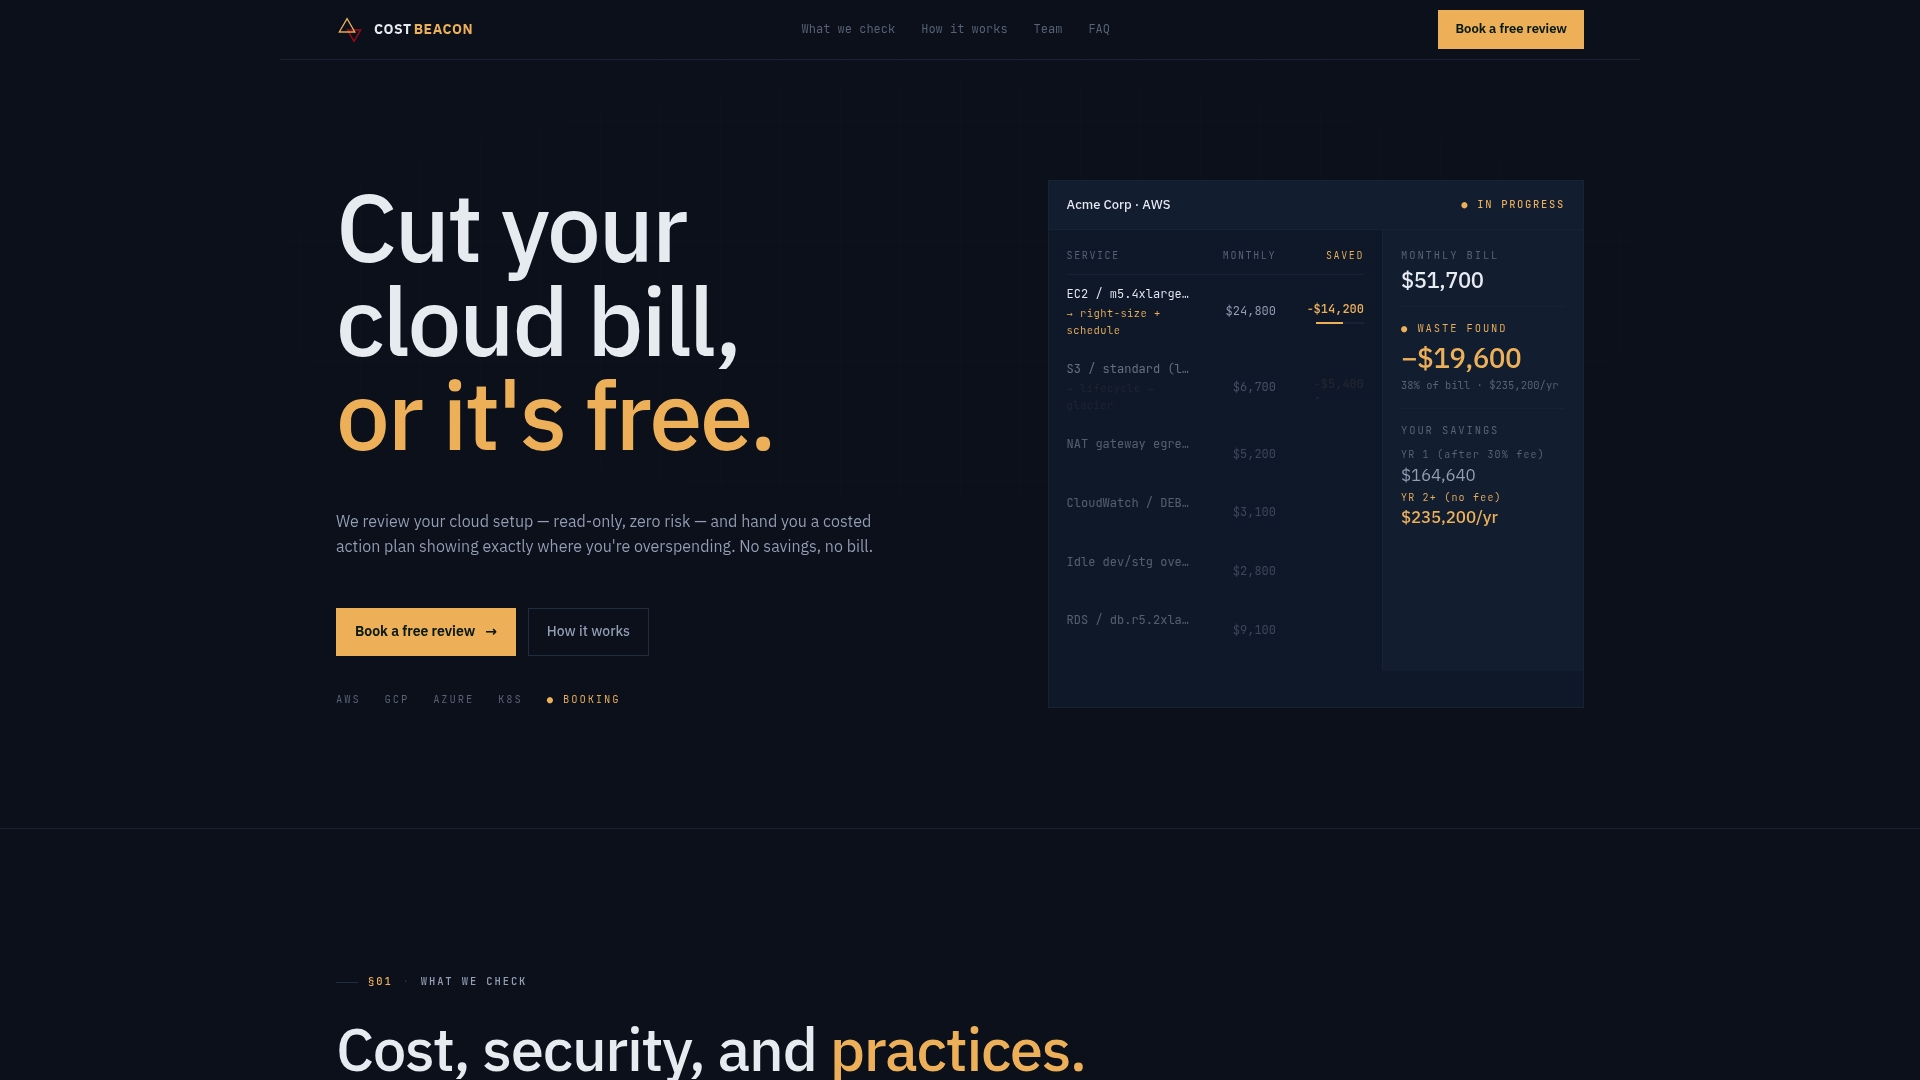
The engagement carries no upfront cost. Cost Beacon only invoices a percentage of the savings actually realized once you implement the recommendations, so there’s no financial exposure in finding out what’s possible. Clients across fintech, telecom, and other industries have seen average bill reductions of 32% through this process, alongside improved security posture from the same audit.
If your anomaly detection is running clean but your baseline still feels heavier than it should, get a cloud cost review from Cost Beacon and see what a prioritized action plan turns up.
Sources
Aaditya works on cloud cost and platform engineering at Cost Beacon, mostly on AWS and Kubernetes estates that grew faster than anyone planned for.
 Cost Beacon