BigQuery Cost Optimization for Engineers: Top 10 Audit + Pay on Savings
The biggest wins in BigQuery cost optimization come from two moves: shrinking the bytes your queries scan and matching your pricing model to how you actually use the warehouse. Start with column pruning and partition filters, materialize the aggregations your dashboards hit every day, and enforce maximum_bytes_billed plus dry-run checks before code ships. Add lifecycle rules to push cold data out of active storage. Then run an audit of your top 10 queries by bytes scanned. That single query usually reveals where most of your bill is hiding.
TL;DR:
- Focus on reducing bytes scanned through column pruning, partition filtering, and materialized views to lower query costs significantly.
- Always set dry-run estimates and maximum bytes billed caps tailored to each environment to prevent runaway costs.
- Prioritize query tuning for ad-hoc queries and storage management for infrequently accessed data, especially by shifting cold data to external storage.
- Use reservation slots for predictable workloads and on-demand billing for bursty, unpredictable querying patterns to optimize expenditure.
- Implement continuous monitoring, tagging, and regular audits with AI assistance to sustain cost savings and avoid recurring overspending.
Table of Contents
- How does BigQuery pricing actually work?
- Query-level playbook: projection, partitioning, clustering, and safe caps
- Storage levers: retention, lifecycle rules, and format choices
- Choosing on-demand vs. reservations: how to size slots correctly
- Cost-effective serving: materialized views, BI Engine, and caching
- Visibility and guardrails: how do you track who’s spending what?
- Building your 30 to 90 day optimization runbook
- Why ad-hoc fixes plateau and structured audits don’t
- Get a pay-on-savings audit of your BigQuery spend
- Sources
How does BigQuery pricing actually work?
BigQuery runs on two billing models, and picking the wrong one for your workload is the single most common reason teams overspend.
On-demand pricing charges you per byte processed. Every query has a minimum billed amount of data scanned, so even a query returning one row against a huge table gets charged for the full projection it touched, not the row count you got back. This is the trap that catches new users: LIMIT 10 does not reduce bytes scanned. BigQuery still reads every byte from the columns you selected before it trims the result set. If you’re running exploratory analysis with unpredictable query patterns, on-demand keeps costs proportional to actual use. If you’re running the same heavy pipeline every hour, on-demand can quietly become the most expensive option on the table.
Capacity-based pricing, sold as slots or reservations, buys you a fixed pool of compute for a flat rate regardless of bytes scanned. This is where predictable pipelines and steady dashboard traffic belong. The catch is idle-slot waste: a reservation sized for peak load sits half-empty most of the day, and you’re paying for capacity nobody is using. Google Cloud’s cost optimization guidance treats reducing bytes scanned as the highest-leverage lever regardless of which pricing model you’re on, because query efficiency compounds under both.
Storage pricing has its own quirks. Active storage costs more per gigabyte than long-term storage, and BigQuery automatically drops any table or partition into the cheaper long-term tier once it goes an extended period without modification, according to BigQuery’s own cost-control documentation. Time-travel windows (the period BigQuery retains previous table versions for recovery) also add to active storage billing, and streaming inserts cost more per byte than batch loads.
A rough rule of thumb for prioritizing where to look first:
- Spiky, ad-hoc query patterns: attack bytes scanned first. Pricing model matters less when usage is unpredictable.
- Steady, scheduled pipelines: check whether slots would beat on-demand at your volume before touching query logic.
- Large historical tables that rarely change: look at storage tier and time-travel settings before anything else.
- Streaming-heavy ingestion: audit whether you actually need sub-minute latency, or whether batch would cut both storage and compute costs.
Get the pricing model wrong and no amount of query tuning will fix the underlying bill.
Query-level playbook: projection, partitioning, clustering, and safe caps
Most BigQuery bills are inflated by a handful of bad habits repeated thousands of times a day. Here’s the order of operations that fixes the most expensive ones.
-
Kill
SELECT *. Column pruning is the single highest-leverage change available to you, according to Google Cloud’s own best-practices guidance. BigQuery’s columnar storage means a query only pays for the columns it touches, not the whole row. Wide tables with nested arrays or JSON blobs are especially punishing here: a single unnecessary nested field can multiply bytes scanned several times over. Project exactly the columns downstream logic needs, nothing more. -
Partition on the column your queries actually filter by. You have two choices: ingestion-time partitioning (BigQuery buckets rows by load timestamp automatically) or column-based partitioning (you choose a date or timestamp column tied to business logic). Practitioners generally prefer column-based partitioning when queries filter on business dates like
order_dateorevent_date, because it gives BigQuery a precise pruning target instead of an approximation tied to when data happened to load. -
Cluster on one or two high-cardinality keys, not five. Clustering sorts data within each partition by the columns you specify, which lets BigQuery skip blocks that can’t match your filter. The practitioner consensus is clear: one to two well-chosen clustering keys aligned with your most common filters and join conditions deliver most of the benefit, and analytics engineering practitioners warn against over-engineering this by stacking four or five keys expecting compounding returns. It doesn’t work that way. Extra clustering keys add maintenance overhead without meaningfully improving pruning.
-
Enforce dry-run and
maximum_bytes_billedeverywhere. A dry run estimates bytes scanned before you spend a cent, and settingmaximum_bytes_billedon a query causes it to fail before execution if the estimate exceeds your cap, per BigQuery’s cost-control documentation. The practical move is to set different caps for different service accounts. A rogue analyst laptop should have a tight cap. A production ETL account handling legitimate multi-terabyte jobs needs a much higher one. Wiring these caps directly into your SDK wrappers means every job gets the guardrail automatically, instead of relying on individual engineers to remember. -
Refactor joins before they become a problem. Cartesian joins and unfiltered cross joins are budget killers hiding in plain sight. When you’re joining a large fact table against a smaller dimension table, pre-aggregate the smaller side first and filter as early as possible in the query. For multi-step transformations, compute intermediate results once in a CTE or temp table rather than repeating the same subquery three times in one script. Practitioners at scale routinely materialize intermediate results for complex joins and aggregations, then point downstream queries at the smaller materialized table instead of rescanning the original source every time.
-
Instrument for repeat offenders. A query that costs $2 once is a rounding error. The same query run 400 times a day by a scheduled dashboard refresh is a line item on your invoice. Tag jobs with labels and pull job history regularly to spot patterns where the same expensive query shape runs on a loop, so you can fix the root cause instead of re-optimizing symptoms every quarter.
Pro Tip: Before you optimize a query’s logic, run it through dry-run mode and note the bytes estimate. Then make one change at a time (add a partition filter, drop a column) and re-run dry-run after each change. You’ll see exactly which lever moved the needle, instead of guessing which of five simultaneous changes did the work.
Storage levers: retention, lifecycle rules, and format choices
Storage is rarely where the biggest dollar amount hides, but it’s often the most neglected lever, and the choices you make here ripple into query cost too.
Start with expiration policies. Set a default table expiration at the dataset level for anything that doesn’t need to live forever, and set partition-level expiration on tables where only recent slices matter, like staging tables or session logs. Typical policies set shorter expiration for raw staging data, longer for intermediate transformation outputs, and indefinite retention for curated, business-critical tables. Enforce this with a policy check in your deployment pipeline rather than trusting engineers to remember it manually, because forgotten staging tables are one of the most common sources of silent storage bloat.
Long-term storage pricing kicks in automatically once a table or partition goes an extended period without a modification, and the discounted rate applies with no action required on your part, according to BigQuery’s cost documentation. The catch is time-travel: BigQuery’s default seven-day time-travel window keeps old versions of modified data around for that period, and that retained data counts against active storage billing. If your team rarely uses time-travel to recover accidentally deleted or overwritten data, shortening that window is worth checking.
A three-month gap between “last modified” and “today” is the threshold that separates full-price active storage from BigQuery’s automatically discounted long-term rate. Any table your pipelines have stopped touching is a candidate for that lower tier.
A few more storage moves worth putting on your checklist:
- Push genuinely cold data to Cloud Storage. Export it as Parquet and query it through external tables when you need occasional access, keeping it out of active BigQuery storage entirely while preserving queryability.
- Audit for duplicate copies. Backup tables, one-off exports, and abandoned experiment datasets accumulate fast, and nobody deletes them because nobody’s sure who owns them.
- Reconsider streaming frequency. Streaming inserts cost more than batch loads, and Google Cloud’s guidance flags this trade-off directly: if your use case tolerates a 15 or 60 minute delay instead of sub-second freshness, switching to batch loads cuts both ingestion cost and the overwrite churn that inflates time-travel storage.
- Standardize on efficient formats for anything landing in Cloud Storage first. Columnar, compressed formats like Parquet reduce both the storage footprint and the IO cost of any subsequent load job, compared to uncompressed CSV or JSON.
Choosing on-demand vs. reservations: how to size slots correctly
The decision between on-demand and capacity-based pricing comes down to one question: how steady is your baseline utilization?
If your workload is bursty, unpredictable, or dominated by ad-hoc analyst queries, on-demand pricing keeps your bill proportional to actual usage. If you run scheduled pipelines and dashboard refreshes around the clock with a consistent floor of activity, a reservation typically pays back faster, because you’re buying compute at a flat rate instead of paying the per-byte rate every single time. Practitioner guidance on this trade-off recommends starting with the slot estimator, sizing a small reservation against your actual historical query load, and adjusting from there rather than guessing.
A few practices that keep slot spending under control once you commit:
- Map reservations to teams or workloads, not one shared pool. A single global reservation makes it nearly impossible to tell which team’s dashboard refresh is starving another team’s ETL job of slots during a busy afternoon.
- Use autoscaling or flex slots for variable load instead of provisioning for peak demand year round. Flex slots let you commit for as little as 60 seconds, which is useful for short, predictable spikes like a monthly reporting run.
- Watch utilization, not just the invoice. Low slot utilization with frequent backlog and queue delays means you’re either under-provisioned during peaks or your workloads aren’t distributed evenly across the day.
- Mix models deliberately. Nothing stops you from running production pipelines on a dedicated reservation while leaving ad-hoc analyst access on on-demand billing under a separate project. Most mature organizations end up running both simultaneously, with clear boundaries around which workloads sit where.
The mistake to avoid is treating this as a one-time decision. Query patterns shift as teams grow, and a reservation sized correctly six months ago can easily be over- or under-provisioned today.
Cost-effective serving: materialized views, BI Engine, and caching
Dashboards are one of the most reliable sources of repeated, avoidable BigQuery spend, because the same expensive query often runs dozens or hundreds of times a day for different viewers hitting refresh.
Materialized views precompute and incrementally update query results, so a dashboard reading from an MV scans a fraction of what it would scanning the base tables directly. Practitioner recommendations pair materialized views with incremental models specifically to cut this kind of repeated compute across an organization’s whole reporting layer. Precomputed summary tables serve a similar purpose but require you to manage the refresh logic yourself, which makes sense when your aggregation logic is complex enough that BigQuery’s automatic MV maintenance can’t keep up.

BI Engine adds an in-memory acceleration layer on top of your dashboards, which is worth testing for anything with a high refresh rate or a lot of concurrent viewers. Start with a small reservation and measure the actual cache hit rate before scaling it up. It is not a fix for badly designed queries underneath.
Result caching gets underused, largely because most engineers don’t design queries with it in mind. BigQuery automatically caches identical query results for a period, but that only helps if the query is deterministic: same SQL, same parameters, same output. Dashboards built with dynamic date ranges or ad-hoc filters break that determinism on every load. Where parameters vary constantly, a materialized view beats relying on result cache, since the cache can’t help you if the query text changes every time.
- Use temporary tables to hold intermediate results within a session instead of rescanning the same base tables across multiple downstream steps.
- Design dashboard queries with fixed, predictable parameters wherever the business logic allows it, so the result cache actually gets hit.
- Reserve BI Engine testing for dashboards with genuinely high concurrency, not low-traffic internal reports where the acceleration cost outweighs the benefit.
Pro Tip: If a dashboard’s underlying query changes even slightly between loads, like a timestamp filter set to “now,” you’ve broken result caching without realizing it. Round timestamps to the nearest hour or day where the business logic tolerates it, and you’ll get far more cache hits.
Visibility and guardrails: how do you track who’s spending what?
Savings that aren’t governed don’t stay savings. Within a quarter, unlabeled ad-hoc queries and forgotten scheduled jobs creep the bill right back up.
- Make labeling mandatory, not optional. Every job and query should carry labels for team, product, and environment at minimum. Enforce it at the CI/CD or query-wrapper level so it isn’t dependent on individual habits, and reject unlabeled production jobs outright.
- Query
INFORMATION_SCHEMAand your billing export regularly. BigQuery’s job history and billing export data let you build a simple top-N query: the ten most expensive queries, datasets, or users over the last 30 days, ranked by bytes billed. This single report usually surfaces 80% of your optimization opportunity in one sitting. - Set budgets and alerts at the project and label level, not just at the billing-account level. A single alert on total spend tells you something’s wrong after the fact. Budgets scoped to individual teams tell you which team, days before the invoice arrives.
- Apply differentiated
maximum_bytes_billedcaps by environment. Google Cloud’s own guidance on cost control recommends segmenting these caps by service account, keeping development and ad-hoc accounts tightly capped while production accounts get headroom appropriate to legitimate workloads. This should live in your SDK wrappers, not in individual scripts. - Schedule a recurring top-query audit and automate anomaly detection where you can. A monthly review catches the slow creep that daily monitoring misses, and tying alerts to a defined runbook action means an anomaly triggers an actual fix, not just a Slack message nobody follows up on.
| Governance signal | What it catches | Where to look |
|---|---|---|
| Missing labels | Untracked spend with no clear owner | Job metadata / CI enforcement |
| Top-N by bytes billed | The handful of queries driving most of the cost | INFORMATION_SCHEMA.JOBS |
| Budget alerts by team | Departments quietly exceeding their allocation | Billing export + budget API |
maximum_bytes_billed violations |
Runaway or malformed queries before they bill | Per service-account caps |
Building your 30 to 90 day optimization runbook
Cost optimization fails when it’s treated as a one-time cleanup instead of a structured program. Practitioner frameworks for this generally follow the same sequence: inventory current spend, match pricing to workload, refactor the worst offenders, fix how dashboards are served, then lock in governance so the gains hold.
- Weeks 0 to 2, quick wins. Run the top-10-queries-by-bytes audit. Apply column projection and partition filters to those queries immediately. Turn on dry-run checks and set a low
maximum_bytes_billedcap for every dev and ad-hoc service account. Expect this phase to deliver the fastest visible drop in your bill, since it targets the queries already known to be worst. - Weeks 2 to 8, medium projects. Add proper partitioning and clustering to your heaviest tables. Build materialized views for your busiest dashboards. Automate lifecycle and expiration rules across every dataset instead of handling them table by table. This is where schema-level changes replace query-level patches.
- Ongoing, quarterly initiatives. Evaluate whether a slot commitment now pays back given your steady-state usage. Stand up a proper billing attribution setup so every team can see its own spend without asking. Keep the top-query audit running as a recurring calendar item, not a one-off exercise.
Track a small set of metrics through all three phases: bytes scanned per query, cost per dashboard refresh, and slot utilization if you’ve bought reservations. Acceptance criteria should be concrete. A refactored query should show a specific percentage drop in bytes scanned on its next dry run, and a new materialized view should show a measurable hit rate within its first week of use.
| Phase | Timeframe | Primary lever | Success signal |
|---|---|---|---|
| Quick wins | 0 to 2 weeks | Query-level fixes on known offenders | Bytes scanned drops on the top-10 list |
| Medium projects | 2 to 8 weeks | Schema and serving changes | Dashboard queries scan a fraction of base table size |
| Long-term | Quarterly | Pricing model and governance | Predictable, attributed spend by team |
Why ad-hoc fixes plateau and structured audits don’t
Most in-house BigQuery cost optimization efforts hit the same wall: someone spends a week fixing the five worst queries, spend drops, everyone moves on, and six months later the bill has crept right back to where it started. That happens because query-level fixes address symptoms. The underlying causes, unlabeled ownership, no budget accountability, no recurring audit habit, never get touched.
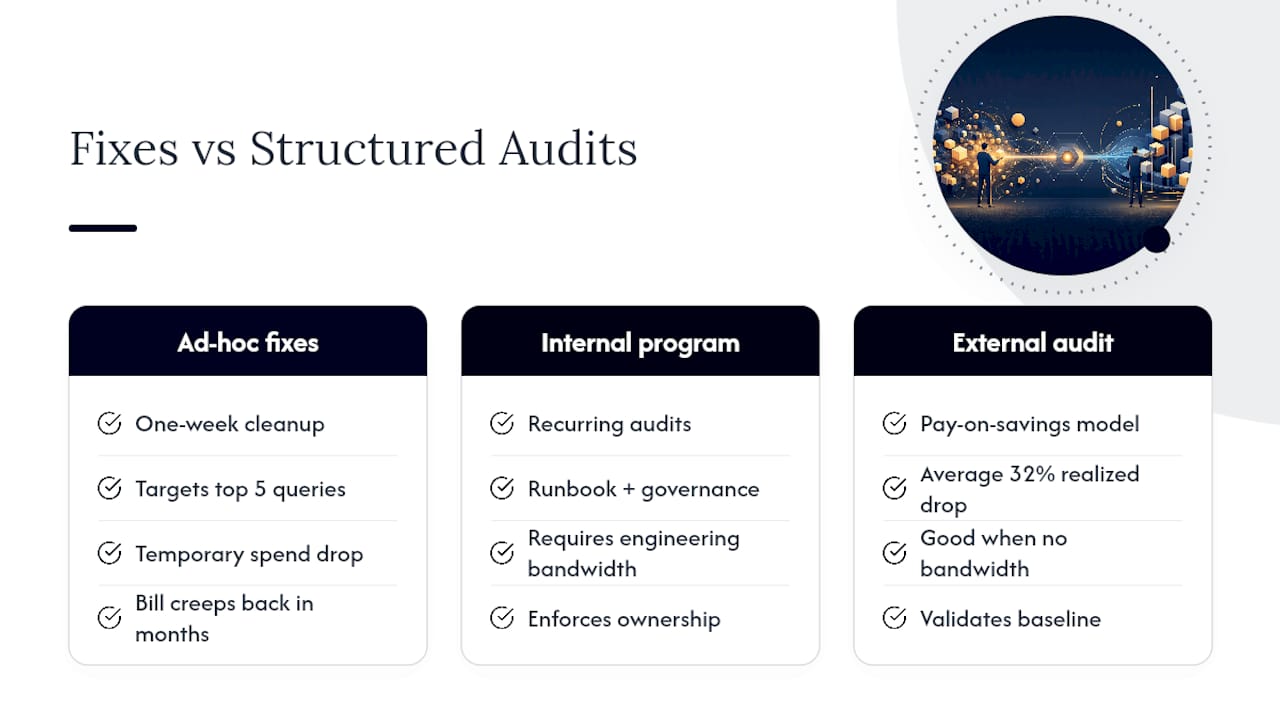
Combining AI-driven analytics with hands-on engineering review tends to catch what a purely manual audit misses, because pattern detection across months of job history surfaces waste that no single engineer scanning a dashboard would notice. Some firms build pay-on-savings audits around exactly this combination, with average realized bill reductions across clients reported at 32%.
An internal program makes sense when you already have the engineering bandwidth and the organizational will to enforce governance long after the initial cleanup. An external audit makes more sense when neither of those is true yet, or when you simply want a second set of eyes to validate that your existing setup isn’t leaving money on the table. The two aren’t mutually exclusive. Plenty of teams bring in an outside audit specifically to establish the baseline and the runbook, then run the ongoing governance themselves.
— Aaditya Parashar
Get a pay-on-savings audit of your BigQuery spend
If you’ve made it this far, you already know the levers. The harder part is finding out which ones apply to your actual environment, and doing it without burning a sprint on manual query archaeology. A pay-on-savings cloud cost and security review can combine AI-driven analytics with hands-on engineering, to provide a prioritized action list with expected savings per item, not a generic report.
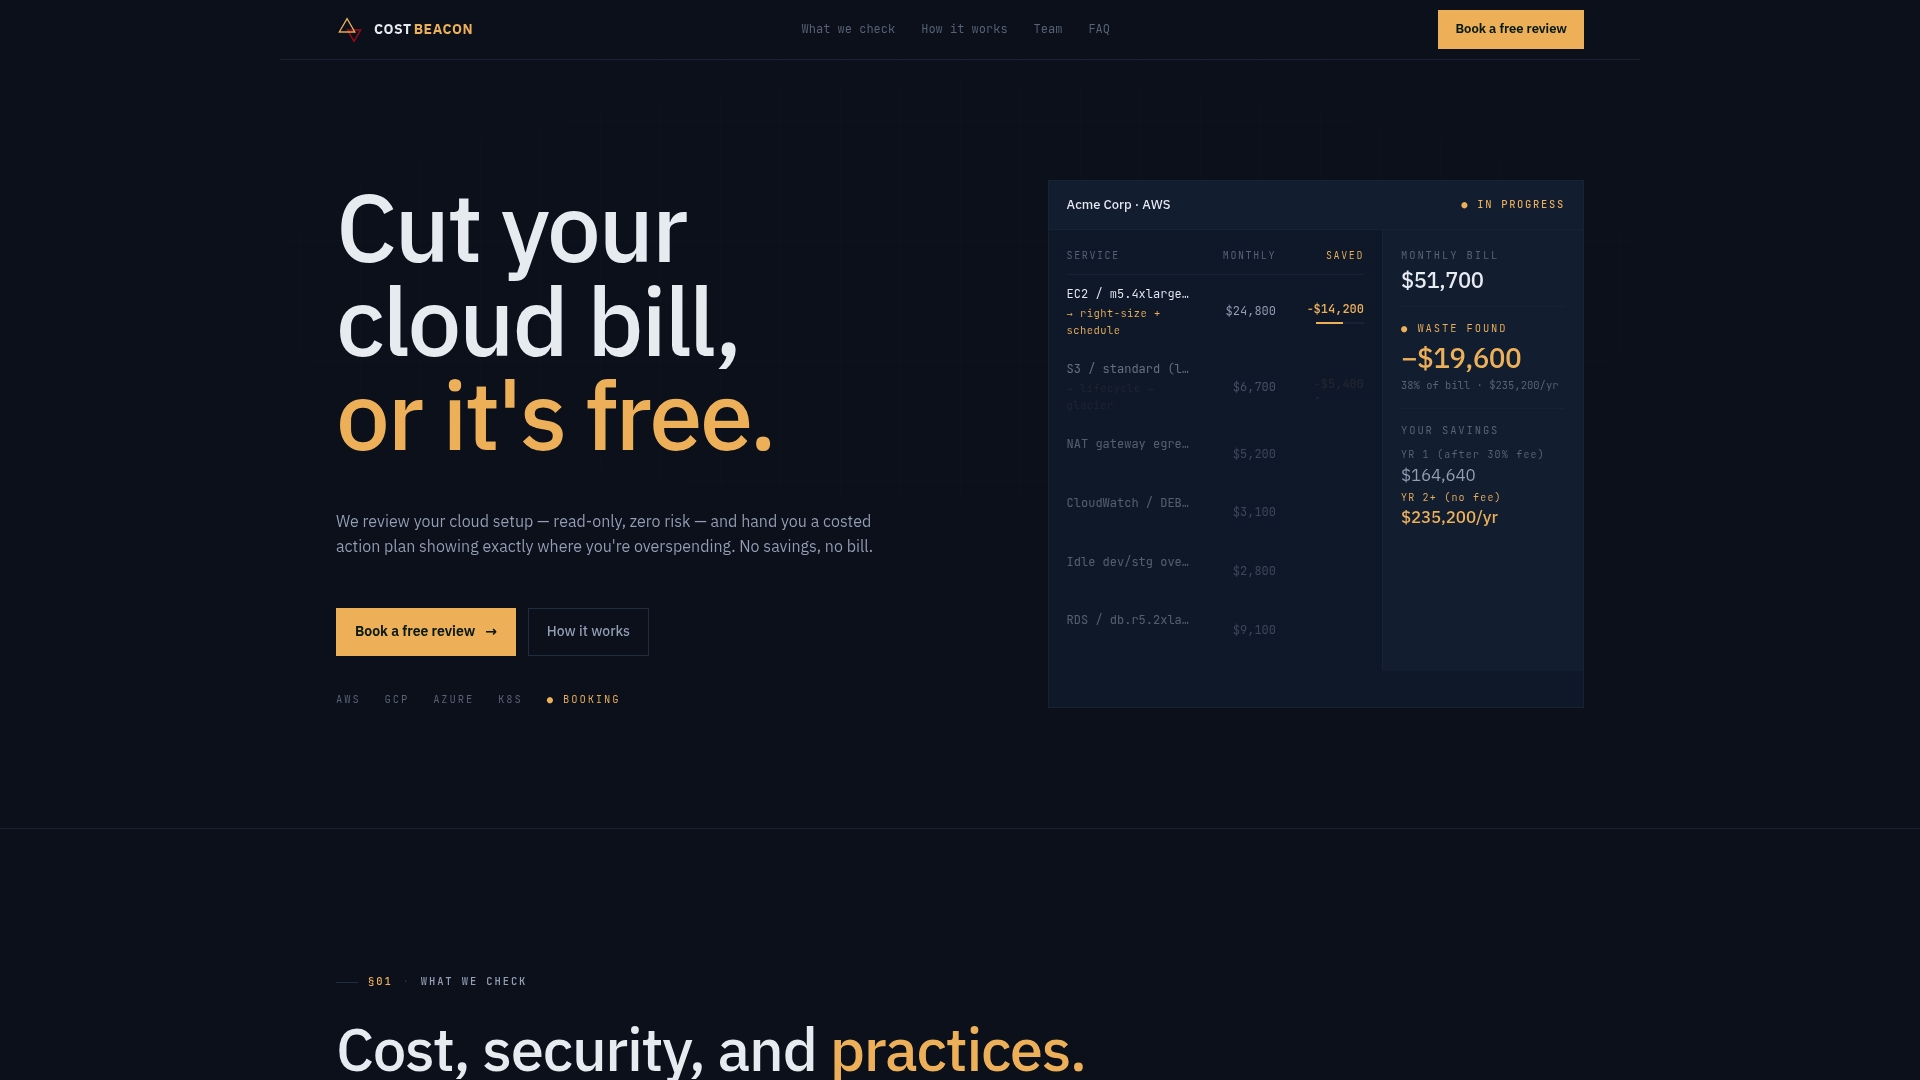
There is often no upfront fee, with invoicing based on a percentage of the savings actually realized, minimizing financial downside to finding out what’s on the table. Such engagements can cover BigQuery bytes-scanned patterns, storage tiers, and reservation sizing alongside the rest of a cloud footprint, with optional hands-on implementation support once the action plan is set. If your last invoice made you wince, start a review with Cost Beacon and see what a prioritized, engineer-reviewed audit turns up.
Sources
Aaditya works on cloud cost and platform engineering at Cost Beacon, mostly on AWS and Kubernetes estates that grew faster than anyone planned for.
 Cost Beacon