Fix client errors, tune prompts, and enable prompt caching first — these three moves typically reclaim the most Amazon Bedrock spend for the least engineering effort. Layer on intelligent prompt routing, cross-region inference, and batch or flex tiers next, then reserve model distillation for stable, high-volume tasks. Caching alone can cut input token costs by up to 90% on cached traffic, batch inference runs roughly 50% cheaper than on-demand, and distillation can shave up to 75% off narrow, repetitive workloads.
TL;DR:
- Fix operational errors and prompt bloat first, as they can silently account for 5 to 15 percent of total Bedrock spend.
- Prompt caching can cut input token costs by up to 90% and reduce latency by 85%, but only if cache hit rates stay above 3:1 over time.
- Routing simple queries to cheaper models and using cross-region profiles can lower costs by up to 30 percent without impacting latency.
- Batch processing with the flex tier and model distillation only become worthwhile at high volumes, generally above 10 million monthly invocations.
- Regularly monitor metrics like cache hit ratio, token count, and quota usage to ensure cost-saving measures are effective and maintain predictable savings.
Table of Contents
- What is bedrock cost optimization and where do you start?
- Quick wins: fixing operational waste and prompt bloat
- Prompt caching: economics, implementation, and metrics to watch
- Which routing and capacity tiers cut costs without hurting latency?
- Advanced levers: token compression and model distillation
- What metrics tell you whether cost optimization is working?
- Prioritization matrix and the 30/60/90 rollout
- Practitioner notes and proof points behind this playbook
- How do automated scaling and resource allocation cut Bedrock costs?
- How do cost optimization tools for Bedrock compare?
- How do you cut data storage and I/O costs on Bedrock?
- How much do network and data transfer costs affect your Bedrock bill?
- How should you manage the lifecycle of models deployed on Bedrock?
- Editorial take: why staging beats stacking
- How Cost Beacon helps you find and fix Bedrock cost leaks
- Sources
What is bedrock cost optimization and where do you start?
Bedrock cost optimization is the practice of reducing what you pay per token, per invocation, and per reserved unit of throughput on Amazon Bedrock, without degrading latency or output quality. It sits at the intersection of prompt engineering, capacity planning, and FinOps instrumentation, and it rewards a specific order of operations. Practitioners who have run this at scale consistently recommend fixing operational waste before touching architecture, because errors and prompt bloat can silently eat 5 to 15 percent of total spend before you even get to the interesting engineering work.
That ordering matters more than most teams assume. Get the cheap fixes done, measure what’s left, then decide whether the harder architectural changes are worth the engineering hours.
Quick wins: fixing operational waste and prompt bloat
Client errors are the fastest money leak to plug on Bedrock, and most teams don’t realize how much they’re bleeding until they pull the numbers. A client error rate above 1% deserves investigation.
Run this audit sequence over the next week:
- Pull a 7-day error log broken down by error type, model, and calling service.
- Chart token size distribution across your top 10 callers to spot oversized prompts or runaway context windows.
- Identify the top 5 callers by spend and check whether their retry logic is exponential or naive (naive retries on rate limits are a classic silent cost multiplier).
- Instrument the CountTokens API in staging so every request gets a pre-flight token estimate before it hits production billing.
Once the error picture is clean, turn to the prompt itself. The highest-leverage, lowest-risk changes are almost boring in their simplicity:
- Trim system prompts to only the instructions the model actually needs per call.
- Strip unused tool or function schemas from the request payload; unused schemas still consume input tokens.
- Cap few-shot examples at 2 to 3 unless you’ve proven more examples measurably improve output quality.
- Pre-summarize long documents before they enter the context window instead of pasting raw text.
- Trim conversational turn history to the last few exchanges rather than replaying the entire session.
Right-sizing max_tokens deserves its own line item. Many teams set it generously “to be safe,” but on models with output burndown multipliers, an oversized max_tokens ceiling can inflate your quota consumption even when the model returns a short answer, because quota burndown and billed tokens aren’t always the same number.
Pro Tip: Run CountTokens against your five most frequent prompt templates before you touch anything else. You’ll usually find one template responsible for a disproportionate share of your token spend, and fixing it alone can pay for the whole audit.
Prompt caching: economics, implementation, and metrics to watch
Prompt caching is the single highest-leverage lever on this list, and the billing math explains why. Cache reads are typically billed at roughly 0.1x the cost of a normal input token, while cache writes carry a premium. That asymmetry means caching only pays off once your hit rate clears a real threshold, generally above a certain threshold, or the write premium eats the savings you’re trying to capture.
Statistic: Prompt caching can reduce input token costs by up to 90% and cut latency by up to 85% on supported models, by letting Bedrock skip recomputation of consistent prompt prefixes across repeated calls.
Getting there requires deliberate prompt design, not just flipping a feature flag:
- Put static content (system instructions, tool definitions, reference documents) at the front of the prompt, and keep it in the exact same order every call. Cache hits depend on prefix matching, and a reordered prompt is a cache miss in disguise.
- Use checkpointing to mark the boundary between cacheable static content and the dynamic, per-request portion.
- Choose your TTL based on real traffic patterns. A TTL that’s too short forces constant re-writes; one that’s too long wastes cache storage on stale sessions nobody will hit again.
- In multi-tenant applications, scope caches per tenant or per workspace so one customer’s traffic doesn’t evict another’s cache entries.
Once caching is live, the read-to-write ratio becomes your north star metric. A healthy target sits above 3:1, and pushing hit rate from roughly 62% to 80% typically does more to cut costs than any other single caching adjustment, because it directly reduces the volume of premium-priced writes.
Watch these CloudWatch metrics on a rolling basis:
- CacheReadInputTokens — total tokens served from cache; this is where your savings actually accrue.
- CacheWriteInputTokens — tokens written to establish or refresh cache entries; this is your cost exposure.
- Hit ratio — reads divided by total cacheable requests; track it daily, not just at rollout.
- Read/write ratio — the clearest single signal for whether your cache design is paying for itself.
To calculate real savings, take the token delta between a cached and uncached run of the same workload, multiply by the price difference between standard input tokens and cache-read tokens, then multiply by call volume. Do this before and after any prompt restructuring, because reordering content even slightly can quietly break your prefix matching and tank your hit rate without an obvious error anywhere in your logs.
If the ratio isn’t trending toward 3:1 by day 5, your prompt structure needs work, not more traffic.*
Which routing and capacity tiers cut costs without hurting latency?
Once the operational waste is gone and caching is stable, the next layer of savings comes from choosing where and how requests actually run.
Intelligent Prompt Routing classifies incoming queries by complexity and automatically sends simpler ones to cheaper models, reserving your most expensive model for requests that genuinely need it. For eligible traffic, this can cut costs by up to 30% without any change to the application layer.
Cross-region inference profiles matter more than most teams realize during traffic spikes. Follow these decision rules:
- Use Global profiles when data residency rules allow it. They deliver the highest throughput and roughly 10% lower costs than geographic profiles, and they help eliminate throttling under load.
- Use Geographic profiles only when compliance genuinely requires keeping inference within a specific region.
Service tiers each solve a different problem. Bedrock’s capacity documentation lays out four options:
- Flex for dev, test, and other latency-tolerant workloads where lowest cost matters more than speed.
- Standard for balanced production traffic without extreme latency sensitivity.
- Priority for latency-sensitive, customer-facing applications where a slow response costs you more than the premium.
- Reserved for sustained, predictable high-volume workloads where committed capacity pays for itself over time.
For anything non-real-time, batch processing or the flex tier delivers roughly 50% lower pricing than on-demand. Nightly report generation, bulk document classification, and backlog reprocessing are all strong batch candidates. Reserved capacity only breaks even once your sustained usage is predictable enough that you’d otherwise be paying on-demand rates around the clock.
Advanced levers: token compression and model distillation
Token compression and retrieval optimization are the highest-effort, highest-payoff levers once the earlier fixes are exhausted. Re-ranking retrieved chunks before they enter the prompt reduces the number of low-relevance chunks the model has to process, and testing chunk sizes in the 256 to 512 token range usually finds a sweet spot between context completeness and token cost. Pair that with pre-summarization rules that condense long source documents before retrieval, rather than after.
Model distillation deserves serious consideration once you clear roughly 10 million invocations a month on a narrow, stable task. Distilled student models can run up to 500% faster and up to 75% less expensive than the teacher model they’re trained from, but only for tasks narrow enough that a smaller model can match quality reliably.
The implementation path looks like this:
- Log and collect a representative dataset from real production traffic on the target task.
- Build a distillation pipeline that trains a smaller student model against the teacher’s outputs.
- Run the student model in a shadow A/B test against the teacher, scoring on objective evaluation metrics, not just spot checks.
- Route a small percentage of live traffic to the student model with a safe fallback path back to the teacher model if quality metrics slip.
Skip distillation if your task set is broad or still evolving. Retraining a student model every time your prompt logic changes usually costs more engineering time than it saves in inference spend.
What metrics tell you whether cost optimization is working?
You cannot manage what you don’t measure, and Bedrock gives you the primitives to attribute spend down to the individual application or team. The core metric set every FinOps or platform team should track:
- CountTokens — pre-flight token counts that match exactly what gets billed, useful for design-time cost validation.
- CacheReadInputTokens / CacheWriteInputTokens — the caching cost and savings pair covered above.
- OutputTokenCount — total tokens generated, tracked separately since output pricing differs from input pricing.
- EstimatedTPMQuotaUsage — how much of your tokens-per-minute quota a given workload is consuming in real time.
- Error rates — throttles, timeouts, and malformed request failures, all of which burn quota without producing billable value.
Set up inference profiles with consistent tagging per application, team, or product line, then feed those tags into AWS Cost Explorer and CloudWatch dashboards for per-application attribution. This is where finance teams increasingly want visibility, because savings only compound if they get measured, reported, and reinvested rather than absorbed silently into a shared bill.
Two example calculations worth running monthly: if 20% of your inference traffic is batch-eligible and batch runs at roughly half the on-demand rate, moving that slice saves close to 10% of total inference spend.
| Metric | What it tells you | Where to watch it |
|---|---|---|
| CountTokens | Pre-flight billed token estimate | Staging, before deploy |
| CacheReadInputTokens | Volume served from cache | CloudWatch, daily |
| CacheWriteInputTokens | Cache cost exposure | CloudWatch, daily |
| EstimatedTPMQuotaUsage | Real-time quota consumption | CloudWatch, per profile |
| Error rate | Wasted spend from failed calls | CloudWatch, per caller |
One quota-sizing trap catches teams every time: output burndown multipliers on some models can consume quota at up to 5x the billed token count. Size your Reserved TPM commitments against burndown, not just billed tokens, or you’ll hit throttling long before your bill tells you anything is wrong.
Prioritization matrix and the 30/60/90 rollout
- Days 1 to 30: audit errors, token distribution, and top callers; instrument CountTokens; trim prompts and right-size max_tokens.
- Days 31 to 60: implement prompt caching with A/B validation; enable intelligent prompt routing and cross-region profiles.
- Days 61 to 90: migrate eligible batch workloads; evaluate distillation candidates against the 10-million-invocation threshold; hand off dashboards to FinOps for ongoing tracking.
Practitioner notes and proof points behind this playbook
. The staging logic in this playbook, fix waste first, then cache, then route, then distill, matches what shows up repeatedly across high-volume Bedrock deployments: the cheap fixes get skipped in favor of exciting architectural work, and the bill keeps climbing.
Cost Beacon specializes in identifying and eliminating cloud-related expenses through a thorough audit that combines AI-driven analytics with hands-on engineering expertise, applied to AWS, GCP, Azure, and Kubernetes environments alike. Every engagement runs on a pay-on-savings model, so clients only pay a fee based on savings actually realized, never a flat retainer for a review that might find nothing.
How do automated scaling and resource allocation cut Bedrock costs?
Automated scaling on Bedrock isn’t about spinning compute up and down like a traditional EC2 auto scaling group. Bedrock is serverless at the model layer, so your real scaling lever is provisioned throughput allocation and quota management across inference profiles, not instance counts.

Pair that with dynamic routing rules that shift overflow traffic from a saturated on-demand profile to a Flex-tier profile during off-peak processing windows, rather than letting requests queue and retry.
For workloads with predictable daily or weekly patterns, batch heavy processing windows into flex or batch capacity during known low-priority hours, and reserve Priority-tier capacity strictly for customer-facing traffic that can’t tolerate a queue. This separation matters because mixing latency-sensitive and latency-tolerant traffic on the same capacity tier is one of the most common reasons teams over-provision Reserved capacity they don’t actually need.
Resource allocation also means matching model size to task complexity dynamically, which is exactly what intelligent prompt routing automates. Instead of manually maintaining a static rule set for which requests go to which model, routing evaluates complexity per request and allocates the cheapest capable model automatically. Combined with quota alerts and tiered capacity assignment, this turns scaling from a reactive firefight into a set of pre-configured guardrails that hold under load.
How do cost optimization tools for Bedrock compare?
Most teams reach for one of three approaches to track and control Bedrock spend, and each has a different tradeoff between setup effort and depth of insight.
Native AWS tooling (Cost Explorer, CloudWatch dashboards, AWS Budgets with tag-based alerts) is the right starting point for any team. It’s free, already integrated, and gives you CacheReadInputTokens, CacheWriteInputTokens, and EstimatedTPMQuotaUsage out of the box.
Generic third-party FinOps platforms add cross-cloud visibility and anomaly detection on top of native metrics, useful if Bedrock spend is one line item among many across AWS, GCP, and Azure. They tend to fall short on Bedrock-specific nuance, like distinguishing cache-write premiums from standard input tokens or flagging a degraded read/write ratio before it becomes a budget problem.
Specialized audit engagements, the category Cost Beacon operates in, pair automated analytics with an engineer who actually reads your prompt templates, checks your caching implementation against the 3:1 read/write target, and validates whether your Reserved capacity commitment matches real burndown patterns.
The honest tradeoff: native tooling is free but shallow, generic platforms add breadth but miss Bedrock-specific mechanics, and a specialized audit costs a fee, but only one tied to savings you actually realize.
How do you cut data storage and I/O costs on Bedrock?
Bedrock’s per-token pricing model means input and output tokens dominate most cost conversations, but the data feeding those prompts carries its own cost surface that’s easy to overlook.
Knowledge base storage for retrieval-augmented generation workloads accrues both storage costs for embeddings and vector indices, plus retrieval costs every time a query hits that index. Oversized or duplicated document sets inflate both. Deduplicate source documents before ingestion, and set a re-indexing cadence instead of re-embedding on every minor content change.

Input token cost is directly proportional to how much raw content you push into a prompt. This is where chunk-size tuning pays off twice: smaller, better-targeted chunks (tested in the 256 to 512 token range) reduce both the retrieval cost and the input token bill for the generation call that follows. Pre-summarizing large documents before they ever reach the vector store shrinks that cost at the source rather than trying to compress it downstream in the prompt.
Output token costs deserve equal attention. Right-sizing max_tokens isn’t just a quota consideration, it’s a direct billing lever, since you pay for every output token the model generates, capped or not. Structured output formats (JSON schemas with fixed fields) tend to produce more predictable, often shorter, output token counts than open-ended free text generation for the same task.
Store fine-tuning datasets and evaluation logs in S3 with lifecycle policies that transition older data to cheaper storage tiers or delete it after a defined retention window. It’s a small line item compared to inference, but one that compounds silently across long-running projects.
How much do network and data transfer costs affect your Bedrock bill?
Data transfer costs on Bedrock are usually a smaller line item than token spend, but they’re not zero, and cross-region architecture choices can quietly move that number.
If your application, its data store, and your Bedrock inference profile all sit in the same AWS region, you generally avoid inter-region transfer charges entirely. The moment you introduce cross-region inference profiles for throughput or resilience reasons, you introduce the possibility of transfer costs on data moving between the originating request and the region actually serving it, alongside whatever savings that Global profile delivers on the inference side itself.
For teams running retrieval-augmented generation with vector stores in a different region than their Bedrock endpoint, that retrieval step adds a transfer cost on every single query, not just occasionally. Co-locating your knowledge base and your inference profile in the same region eliminates that recurring charge outright.
VPC endpoints for Bedrock also matter here. Routing traffic through a VPC endpoint instead of the public internet path keeps data transfer within the AWS backbone, which is typically cheaper and more predictable than public internet egress, and it comes with a security benefit as a side effect.
The practical rule: audit your architecture diagram for any place where request payloads or retrieved context cross a region boundary that isn’t strictly necessary for compliance or resilience. Most unnecessary cross-region hops exist because of how the application evolved, not because of a deliberate cost or reliability decision, and they’re often the easiest transfer cost to eliminate once you spot them.
How should you manage the lifecycle of models deployed on Bedrock?
Models deployed on Bedrock, whether foundation models accessed on-demand or custom fine-tuned and distilled models, accrue cost even when they’re not actively serving production traffic, and lifecycle discipline is what keeps that from becoming waste.
Custom and distilled models provisioned with dedicated throughput continue costing money whether or not traffic is flowing to them. Set a clear decommissioning policy: if a fine-tuned model hasn’t served meaningful traffic in 30 to 60 days, either archive it or delete the provisioned throughput and fall back to an on-demand foundation model until volume justifies re-provisioning.
Version your fine-tuned and distilled models deliberately, and retire old versions once a new one passes your evaluation gate rather than running both in parallel indefinitely “just in case.” Parallel model versions double your provisioned throughput cost for capacity you’re only using to hedge against a rollback you may never need.
For distillation specifically, revisit the student model’s performance against the teacher’s periodically. A narrow task’s underlying data distribution can drift, and a student model that was cost-effective and accurate six months ago may need retraining or replacement rather than being left running on stale training data.
Build a quarterly review into your FinOps cadence: which custom models are still earning their provisioned throughput, which distilled models still pass evaluation thresholds, and which foundation model versions have been superseded by a newer, cheaper, or faster option worth migrating to. Bedrock’s model catalog changes often enough that a model you selected a year ago may no longer be the most cost-effective choice for the same task.
Editorial take: why staging beats stacking
Most Bedrock cost advice treats every lever as equally urgent, and that’s the mistake. The research on this is consistent: operational waste alone can account for 5 to 15% of total spend, and that’s money you can reclaim in a week, not a quarter.
The conventional wisdom oversells architectural sophistication. Distillation and intelligent routing get the attention because they sound like engineering achievements, but caching is the lever with the highest ceiling and the lowest barrier to entry for most teams, and it’s frequently implemented halfway, with inconsistent prompt ordering that quietly tanks the hit rate before anyone notices.
If you take one thing from this playbook, take the order of operations. Fix the boring stuff first. Measure before you architect. The teams that skip straight to the impressive fixes usually end up rebuilding their prompt structure six months later anyway, once someone finally checks the cache hit rate.
— Aaditya Parashar
How Cost Beacon helps you find and fix Bedrock cost leaks
Reading a playbook is one thing. Finding out which of these levers actually apply to your specific traffic, error rates, and cache hit ratios is another. Cost Beacon runs a pay-on-savings cloud cost and security review that applies the same staged logic covered here, error and prompt audit first, caching and routing second, architectural changes only where the numbers justify them, directly against your AWS, GCP, Azure, or Kubernetes environment.
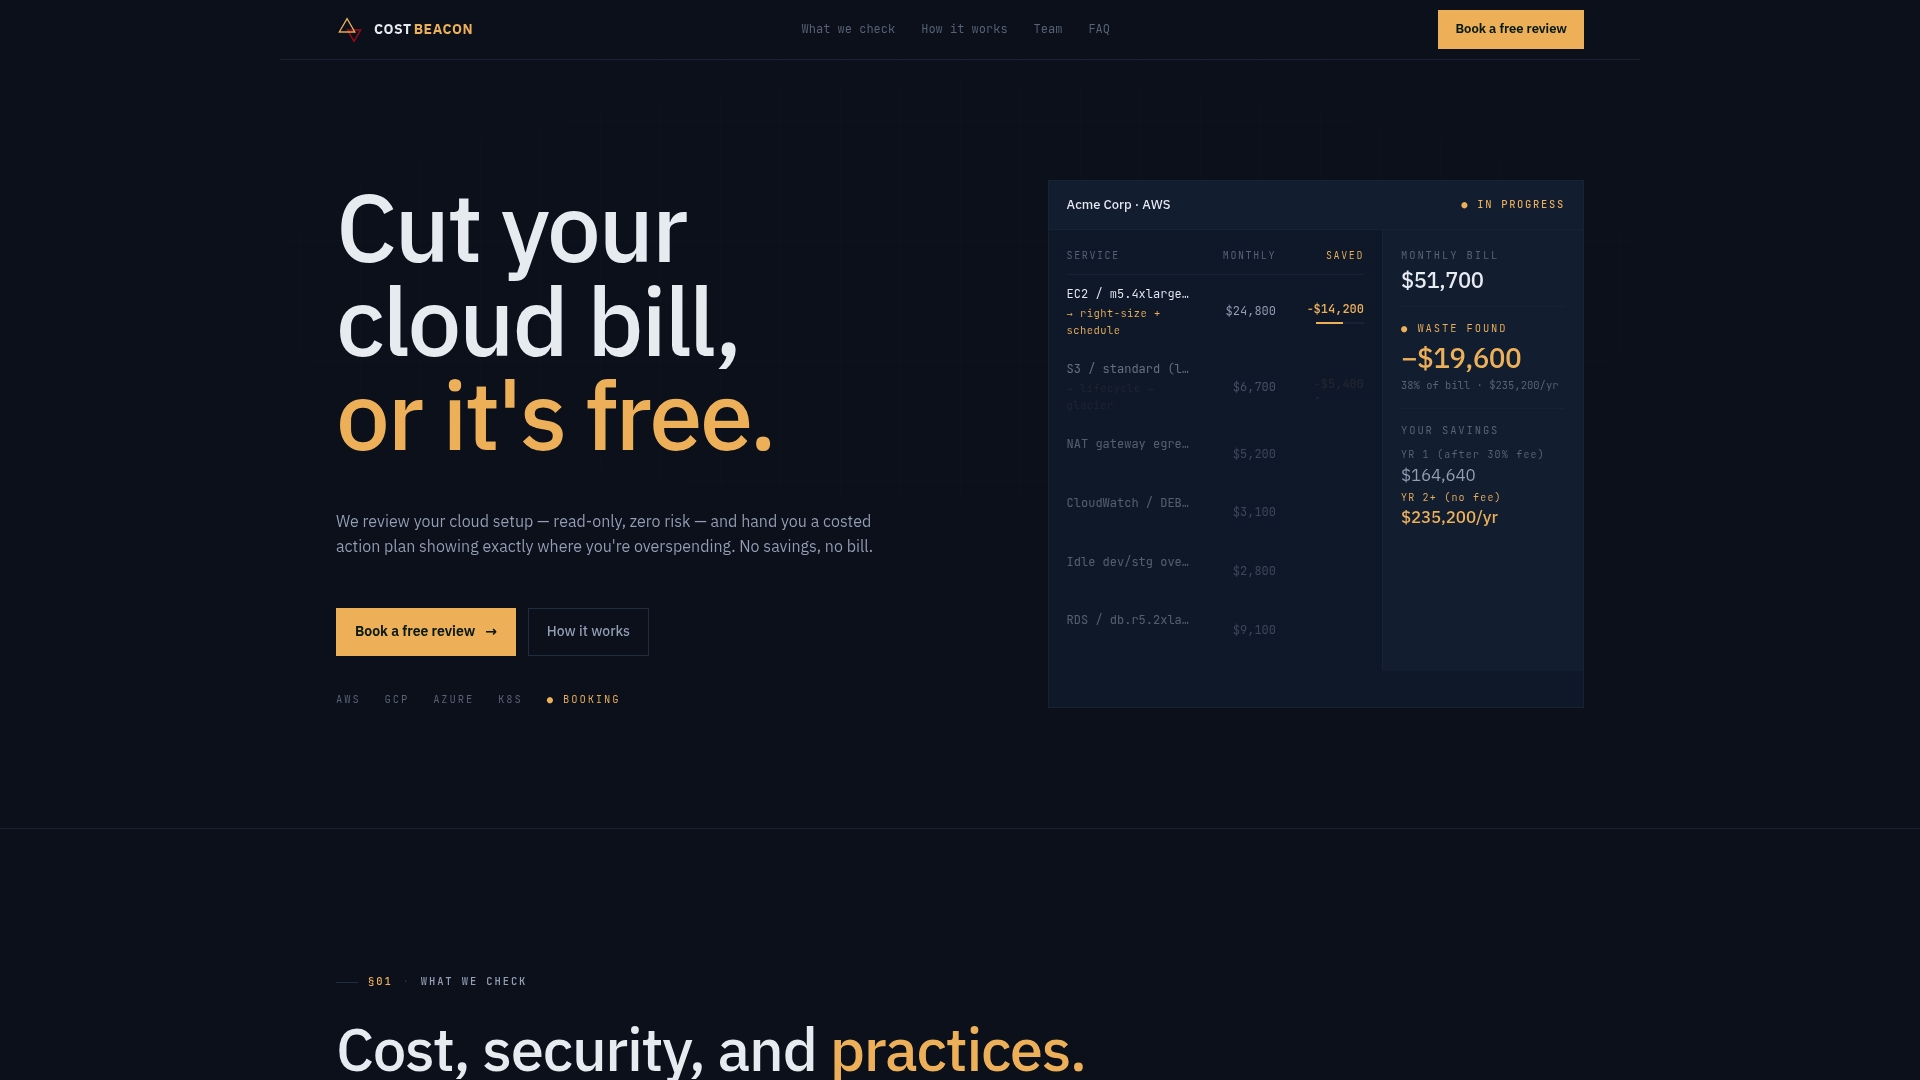
The engagement typically runs 2 to 4 weeks: a full audit of your infrastructure and Bedrock usage patterns, a prioritized savings backlog with estimated impact per item, and a set of validated sample findings so you can see real numbers before committing to implementation. Optional implementation support is available if your team wants hands-on engineering help rather than just the backlog. Because the model is pay-on-savings, there’s no upfront fee and no retainer. You pay a percentage of savings you actually realize, nothing more.
If your Bedrock bill has been climbing faster than your traffic, start a cloud cost and security review with Cost Beacon and get the prioritized findings before you commit engineering time to any of the levers above.
Sources
- Amazon Bedrock prompt caching
- Optimizing Amazon Bedrock costs at scale: A practitioner’s framework for high-volume workloads (Part 1)
- Capacity and performance (Bedrock user guide)
Recommended
Aaditya works on cloud cost and platform engineering at Cost Beacon, mostly on AWS and Kubernetes estates that grew faster than anyone planned for.
 Cost Beacon